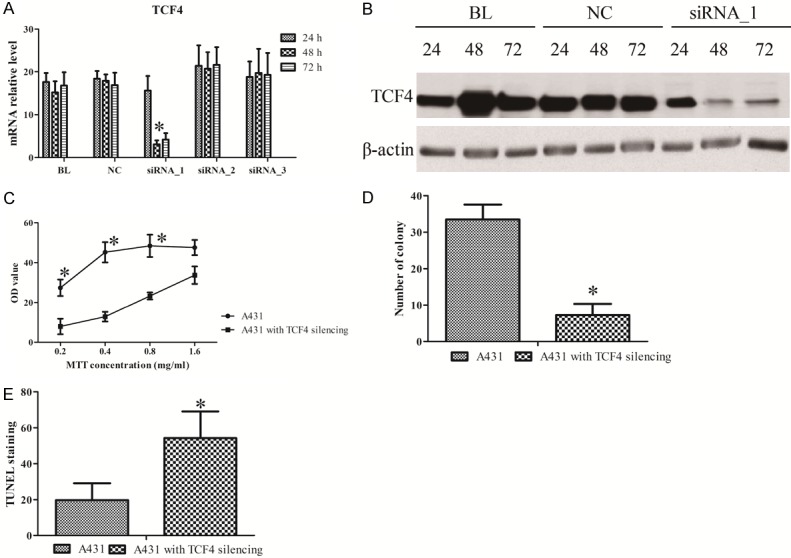
Figure 2.

The effect of TCF4 knockdown in A431 cells. The RNA (A) and protein (B) of TCF4 in A431 cells with siRNA treatment. The assays of MTT (C), transwell (D), and TUNEL (E) in A431 cells with TCF4 knockdown. All data is presented as the mean ± standard error of three individual experiments. “*” means p value less than 0.05 vs control.
