
Figure 3.
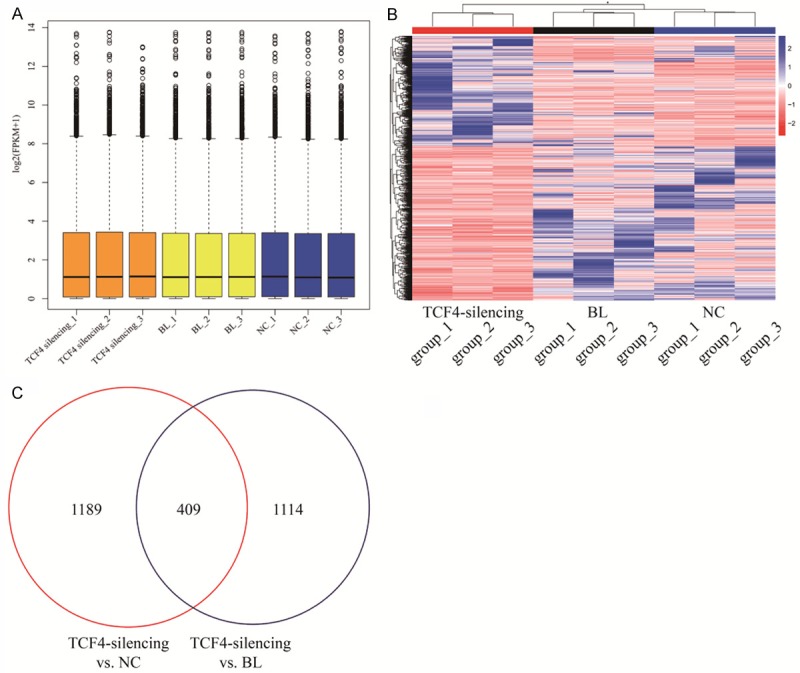
The differentially expressed genes in A431 cells with TCF4 knockdown. A. The FPKM distribution of all RNA-seq data; B. The heatmap of the differentially expressed genes in RNA-seq data. Color bars above the heatmap represent sample groups: red is for up-regulated genes and blue is for down-regulated genes; C. Comparison of the differentially expressed genes between TCF4 silencing vs NC and BL.