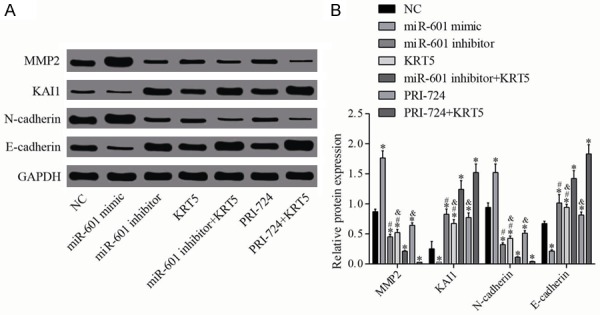
Figure 6.

Relative protein levels of MMP-2, KAI1, N-cadherin and Ecadherin. A. Protein expression levels of MMP-2, KAI1, N-cadherin and E-cadherin were determined by western blot analysis. B. Quantification of the protein expression is shown. *P<0.05 cf. the negative control group; #P<0.05 cf. the miR-601 inhibitor + KRT5 group; &P<0.05 cf. the PRI-724 + KRT5 group. Data are expressed as the mean ± SD, and data were analyzed using oneway analysis of variance (ANOVA). The experiments were performed in triplicate. KRT5, keratin 5; MMP-2, matrix metalloproteinase 2.
