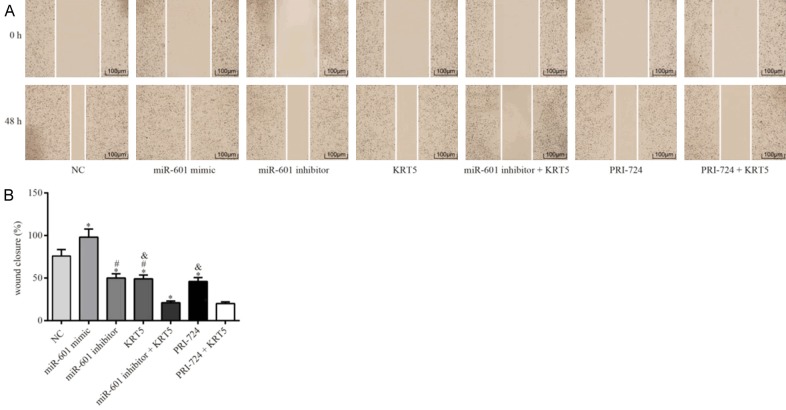
Figure 7.
Migration ability of the PCSCs in each group as detected by scratch wound assay. A. Maps of the cell scratch test are shown. B. Quantification of the wound closure in each group is shown. *P<0.05 cf. the negative control group; #P<0.05 cf. the miR-601 inhibitor + KRT5 group; &P<0.05 cf. the PRI-724 + KRT5 group. Data are expressed as the mean ± SD, and data were analyzed using oneway analysis of variance (ANOVA). The experiments were performed in triplicate. KRT5, keratin 5; PCSC, prostate cancer cell line.

