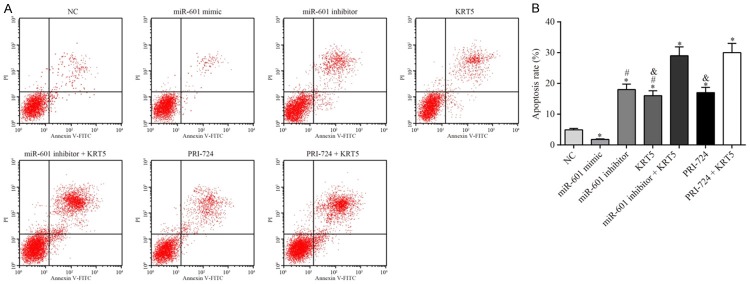
Figure 12.
Apoptosis of the PCSCs in each experimental group. A. Results of the flow cytometric analysis are shown. B. The apoptotic rate of the PCSCs after transfection for 48 h was determined. *P<0.05 vs. the negative control group; #P<0.05 vs. the miR-601 inhibitor + KRT5 group; &P<0.05 vs. the PRI-724 + KRT5 group. Data are expressed as the mean ± SD, and data were analyzed using oneway analysis of variance (ANOVA). The experiments were performed in triplicate. KRT5, keratin 5; PCSC, prostate cancer stem cell.

