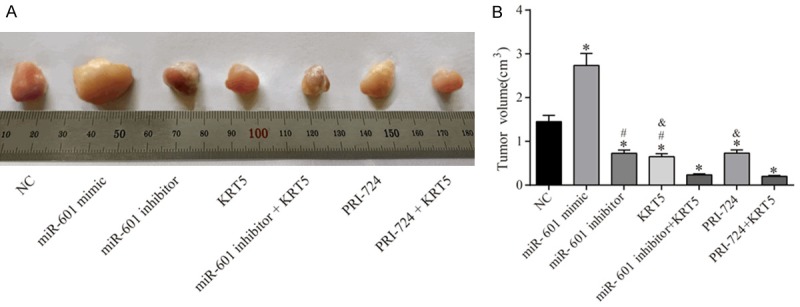
Figure 13.

Results of the xenograft tumor experiments in nude mice. A. Observation of the subcutaneous tumor in nude mice. B. Tumor volume in each group. *P<0.05 vs. the negative control group; #P<0.05 vs. the miR-601 inhibitor + KRT5 group; &P<0.05 vs. the PRI-724 + KRT5 group. n = 5 mice were allocated to each group, and the data were expressed as the mean ± SD, analyzed using ANOVA.
