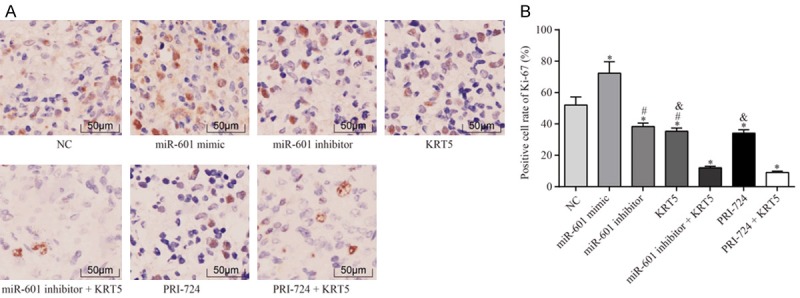
Figure 14.

Expression of Ki-67 in the lymph gland in each group by immunohistochemical analysis. A. The immunohistochemistry staining results are shown. B. Statistical results of positive cell numbers of Ki-67 in lymph node; *P<0.05 vs. the negative control group; #P<0.05 vs. the miR-601 inhibitor + KRT5 group; &P<0.05 vs. the PRI-724 + KRT5 group. The data were expressed as the mean ± SD, analyzed using ANOVA. Each experiment was repeated 3 times.
