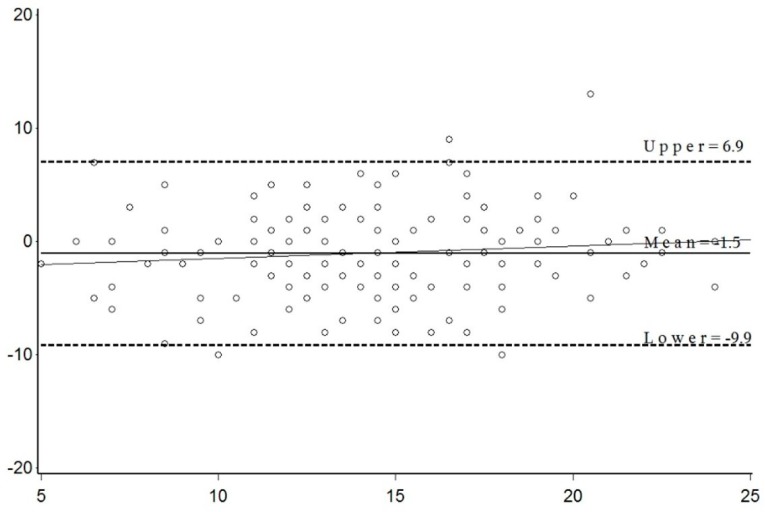
Figure 2.
Bland–Altman plot of difference in score between the FFQ and SDQ-AMD versus the mean score of both methods. The solid line illustrates the mean difference (−1.5), and dotted lines represent the 95% confidence interval, with the upper and lower LOA (6.9 and −9.9, respectively) reflecting ± 2SD from the mean difference. Regression equation: y = 0.11 x − 2.60 (95% CI: −0.058, 0.275, p-value = 0.20). LOA: limits of agreement.

