
Table 2.
Characteristics of the RCTs conducted within the frame of the PREDIMED study, investigating the role of Mediterranean Diet (MD) on: diabetes mellitus (DM), metabolic syndrome (MetS) and obesity.
| Aim of the Study | Number of Subjects | Follow-Up Median (Years) | Main Results of the Study | 1st Author, Journal, Year |
Ref. |
|---|---|---|---|---|---|
| Diabetes Mellitus | |||||
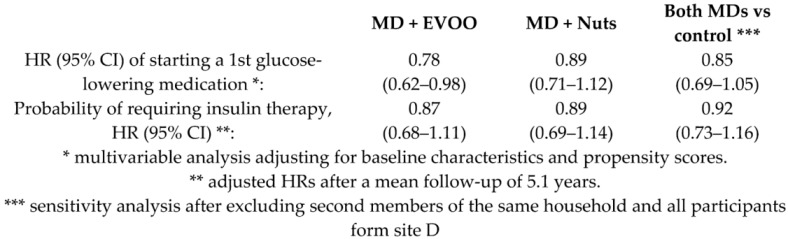
| Effects of MD versus a low-fat diet on the need for glucose-lowering medications | 3230 T2DM |
3.2 |
|
Basterra-Gortari et al. Diab. Care. 2019 |
[33] |
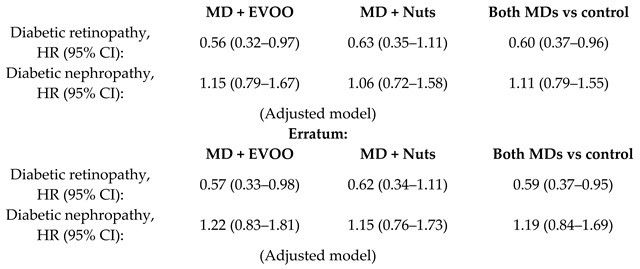
| Long-term effect of a MD on microvascular diabetes complications | 3614 T2DM |
6.0 |
|
Díaz-López et al. Diab. Care. 2015 |
[34] |
| Díaz-López et al. Diab. Care. 2018 |
[35] | ||||
| Incidence of diabetes | 3541 | 4.1 |
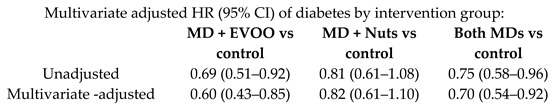
|
Salas-Salvadó et al. Ann Int Med. 014 |
[36] |
| Metabolic Syndrome | |||||
| Plasmatic antioxidant capabilities in Metabolic Syndrome (MetS) patients | 75 | 5.0 |
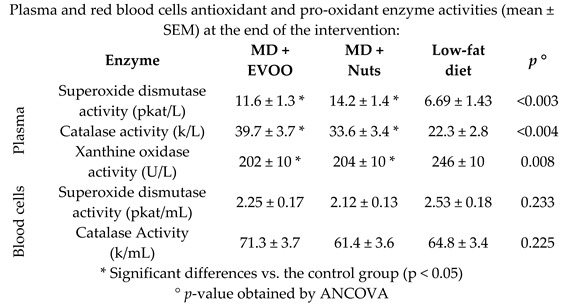
|
Sureda et al. Mol. Nutr. Food Res. 2016 |
[37] |
| Long-term effects of MD on MetS | 5801 | 4.8 |
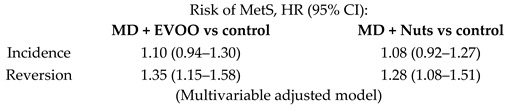
|
Babio et al. Cmaj 2014 |
[38] |
| MD effects on MetS status | 1224 | 1.0 |
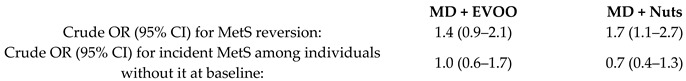
|
Salas-Salvadó et al. Arch. Int. Med. 2008 |
[39] |
| Obesity | |||||
| Effect of a MD on bodyweight and waist circumference | 3985 | 4.8 |
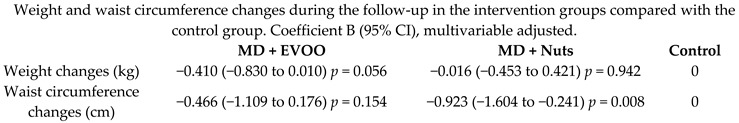
|
Estruch et al. The Lancet. Diab. Endocr. 2019 |
[40] |
| Effect of MD on anthropometric variables and body composition parameters | 305 | 1.0 |
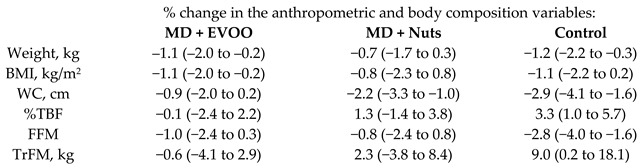
|
Álvarez-Pérez et al. J. Am. Coll. Nutr. 2016 |
[41] |
| Effect of MedD on plasma total antioxidant capacity (TAC) | 187 | 3.0 |
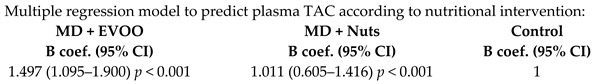
|
Razquin et al. Eur. J. Clin. Nutr. 2009 |
[42] |
BMI: Body Mass Index; CI: Confidence Interval; EVOO: Extra Virgin Olive Oil; FFM: Free Fat Mass; HR: Hazard Ratio; MetS: Metabolic Syndrome; MD: Mediterranean Diet; OR: Odds Ratio; Q: Quartile; TAC: Total Antioxidant Capacity; T2DM: Type 2 Diabetes Mellitus ; TFM: Total Fat Mass; TrFM: Truncal Fat Mass; WC: Waist Circumference; %TBF: percentage of Total Body Fat.