Figure 3.
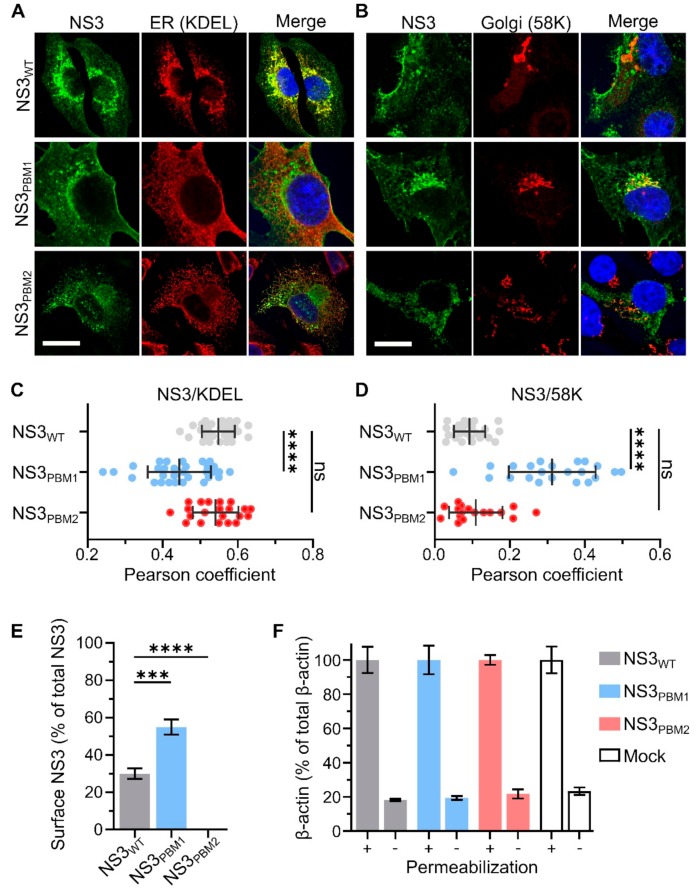
PBM1 and PBM2 are required for the cellular trafficking of NS3. (A,B) Confocal immunofluorescence microscopy (x63) of BSR cells 24 h after infection by either WT BTV (Top row), BTV NS3PBM1 (middle row) or BTV NS3PBM2 (bottom row) viruses. Fluorescence signal of the NS3 labelling is shown in green. The labelling of the endoplasmic reticulum (ER) marker (KDEL protein) is shown in red, as well as the Golgi apparatus marker (58K protein), and the nucleus is shown in blue. Scale bar represents 20 μm (white line, bottom left corner). The colocalization between NS3 and KDEL (C) and between NS3 and 58K (D) were quantified for each virus using the Pearson correlation coefficient. Horizontal lines represent the standard deviation. The mean Pearson correlation coefficients were compared using multiple Wilcoxon-Mann-Whitney Tests (ns p> 0.05; **** p < 0.0001; n = 30). (E) Median surface expression levels of the NS3 protein in infected BSR cells analyzed by flow cytometry detecting Alexa Fluor 488 signal 24 h after infection. The level of membrane-associated NS3 is expressed as the percentage of fluorescence level detected in non-permeabilized cells compared with the total fluorescence level detected in permeabilized cells. The means surface expression level of the NS3 protein was then compared using a t-test (*** p < 0.0005; **** p < 0.0001; n = 3). Vertical lines represent the standard deviation. (F) Negative control, the same experiment was performed to quantify the cytoplasmic beta-actin protein in BSR cells infected with the mutant and WT viruses, or not infected (mock). The «+» and «-» indicate permeabilized and not permeabilized prior to incubation with primary antibodies.

