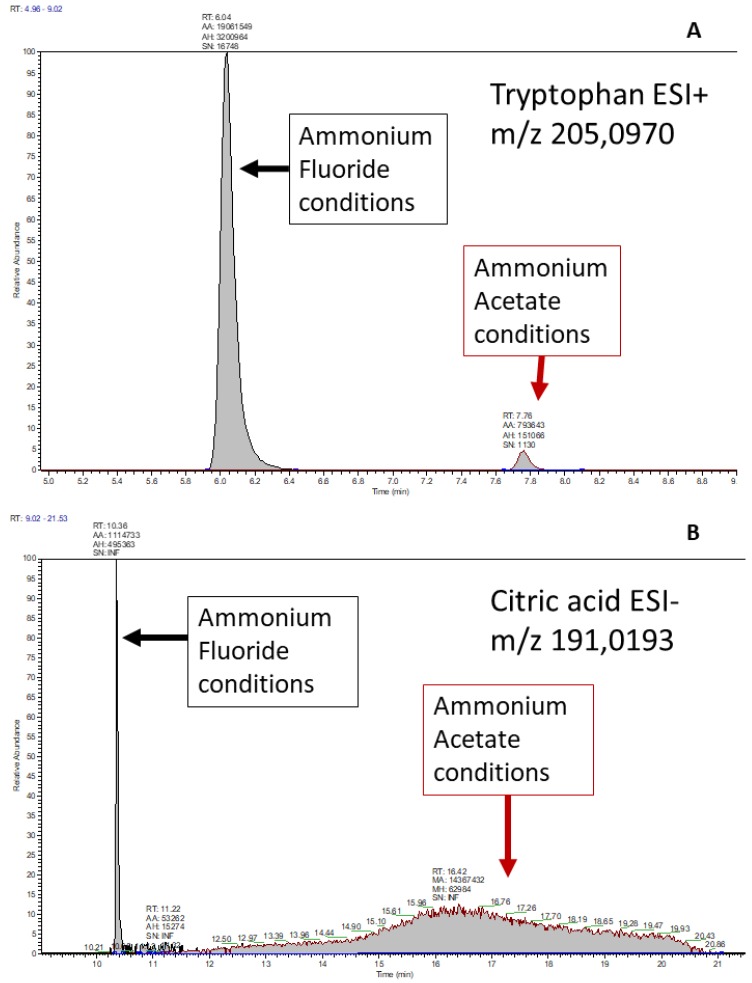
Figure 2.
(A,B) two examples of different peak shape between the two chromatographic methods, reporting tryptophan (up) and citric acid (below). In the first case, tryptophan showed higher intensity and peak area, but similar peak shape and lower apparent retention factor in the AF method. In the second case, in the AA method the signal of the citric acid is present, but no automatic detection software is able to integrate correctly such 10 minute-wide peak. In contrast, the AF method shows a fairly nice peak for citric acid.

