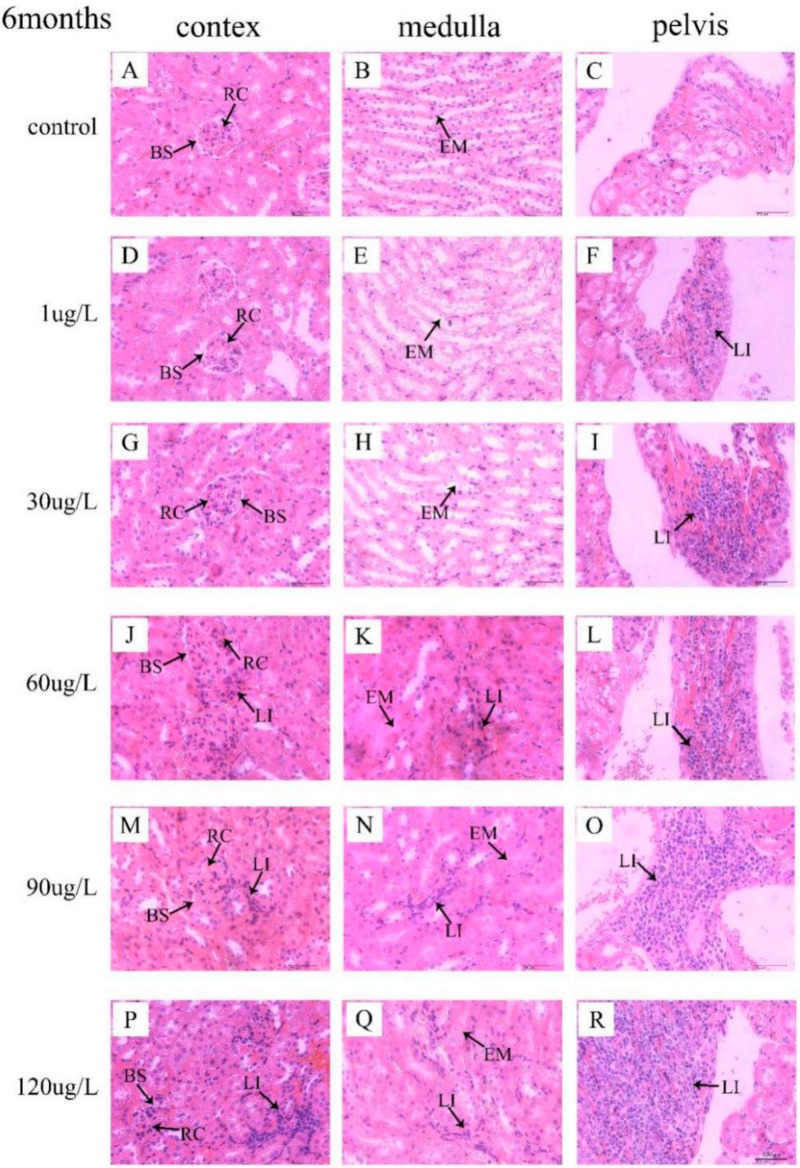
Figure 6.
Histopathology analysis of kidney tissues from the mice treated with MC-LR for 6 months. The structure of histological sections of kidney was observed by H&E staining. Bar = 100 µm means original magnification × 400. (A–C) were control group; (D–R) were MC-LR groups. RC: renal corpuscles; BS: Bowman’s space; LI: lymphocytes infiltrate; EM: eosinophilic material.

