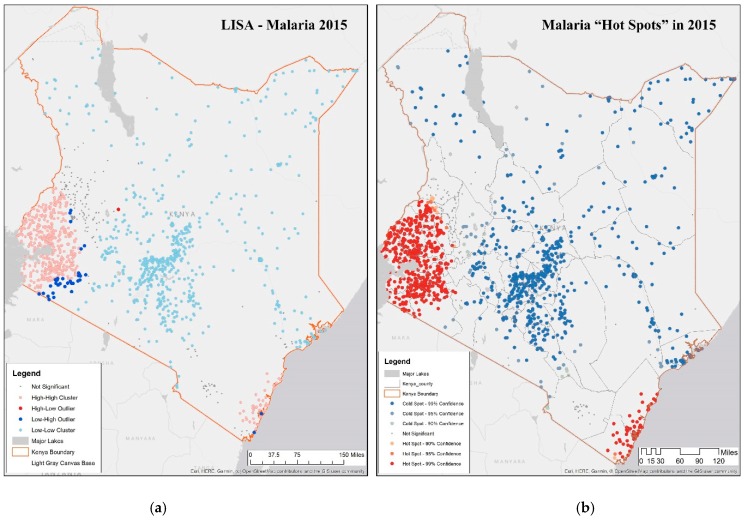
Figure 3.
LISA and Getis-Ord G statistics characterizing local spatial autocorrelation in malaria incidence rate per 1000 in Kenya in 2015. (a) LISA hot spots measure showing location high-high clusters around Lake Victoria in the west and eastern sea coast; (b) Getis-Ord G showing three levels of statistical significance in hot and cold spots. (See Supplementary Figures S1–S6 for results in 2000, 2005, 2010).

