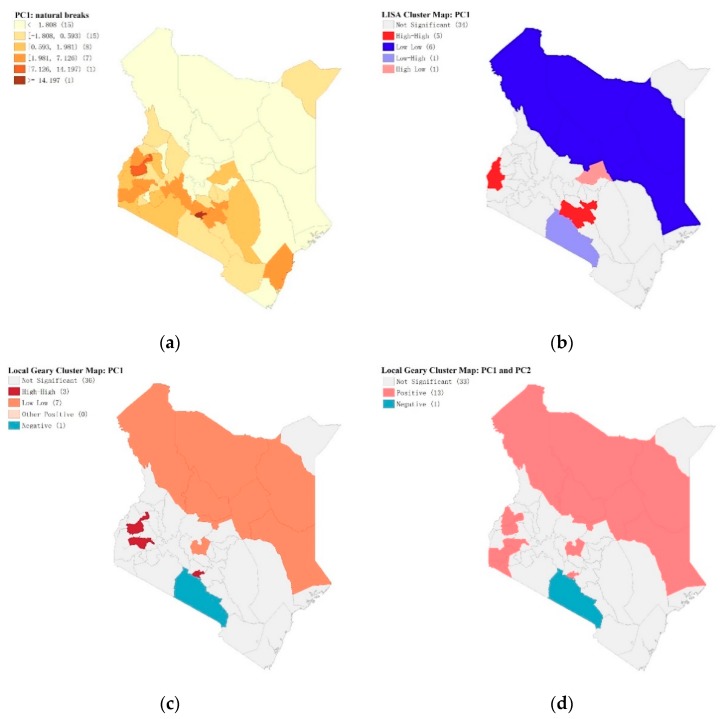
Figure 7.
C and Moran’s I statistics (a) Map of PCI natural breaks showing high values in the two endemic areas. (b) Local Moran’s clusters, PC1 showing low-low clusters of survey responses. (c) Local Geary’s C clusters, PC1. (d) Bivariate local Geary, PC1, and PC2; notice negative cluster south of Nairobi in Kajiado county. (See Supplementary Figures S42 and S43 for Map of PC2 natural breaks and LISA and Local Geary’s C Clusters).

