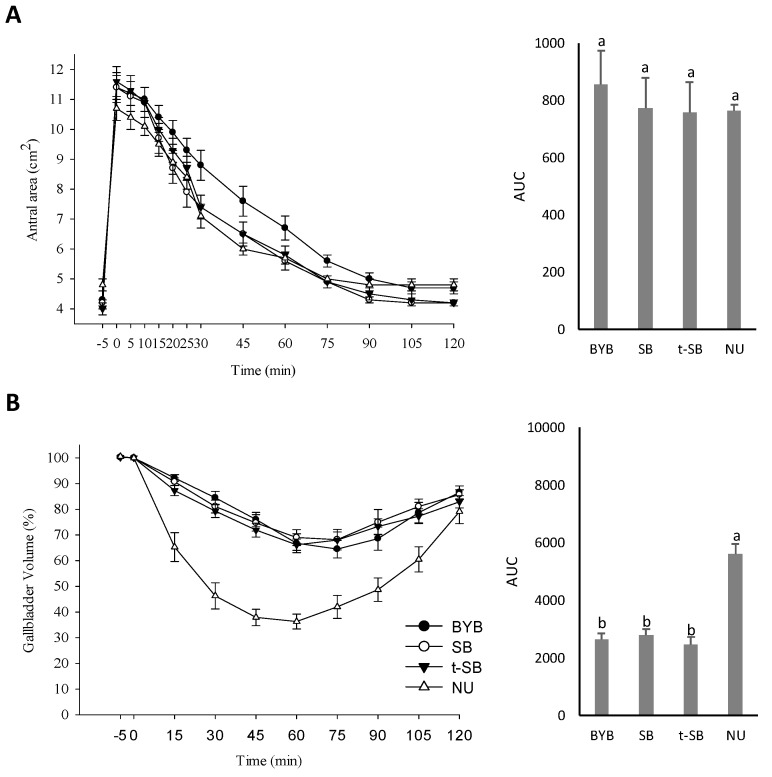
Figure 3.
Gastric (A) and gallbladder (B) emptying curves in response to the ingestion of the test meals (isovolumetric). Time-dependent changes of antral area (cm2) are represented as mean ± SEM (Standard Error of the Mean) and area under curve (AUC). Time-dependent changes of gallbladder volume (mL) are represented as mean ± SEM and area under curve (AUC). BYB, baker´s yeast bread leavened with baker’s yeast (1.5%, w/w) for 90 min at 30 °C; SB, sourdough bread leavened with S4 (20%, w/w) and baker’s yeast (1.5%, w/w) for 90 min at 30 °C; t-SB, sourdough bread leavened with S24 (20%, w/w) for 4 h at 30 °C. NU, Nutridrink used as the reference. a–b Within the same parameter, values with different superscript letters differ significantly (p < 0.05).

