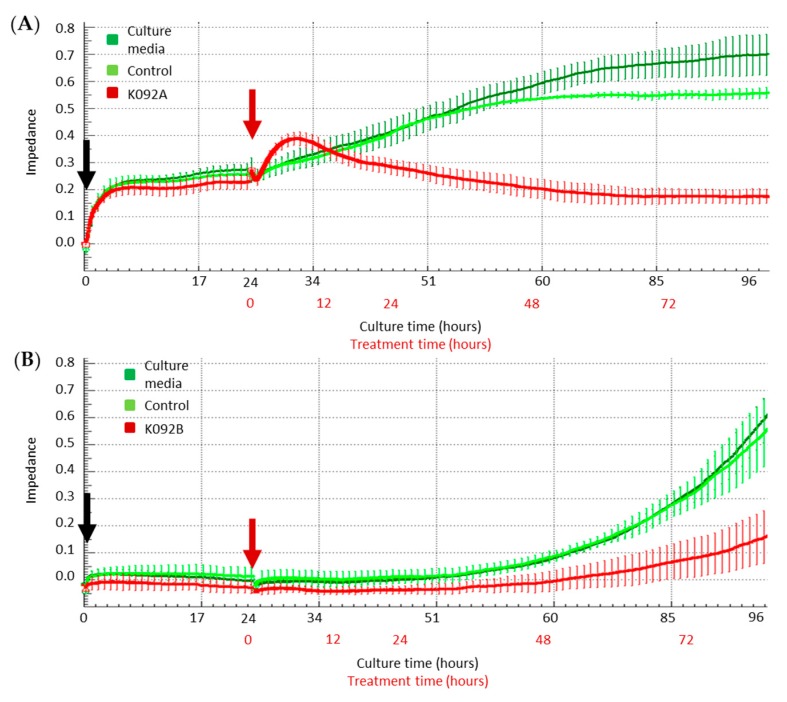
Figure 3.
Real-time electric impedance in culture plates of cells treated with K092A or K092B. Real time analysis of impedance in cultures of control cells (dark and light green curves) and of K092A-treated ZR-75-1 cells (A) (red curve) or K092B-treated MDA-Pca-2b cells (B) (red curve) during the first 96 h of culture time (black numbers) and during 72 h in presence of treatment (red numbers). Cells were seeded (black arrow) 24 h before the treatment (red arrow) and results were represented by mean ± SD of 4 replicates.

