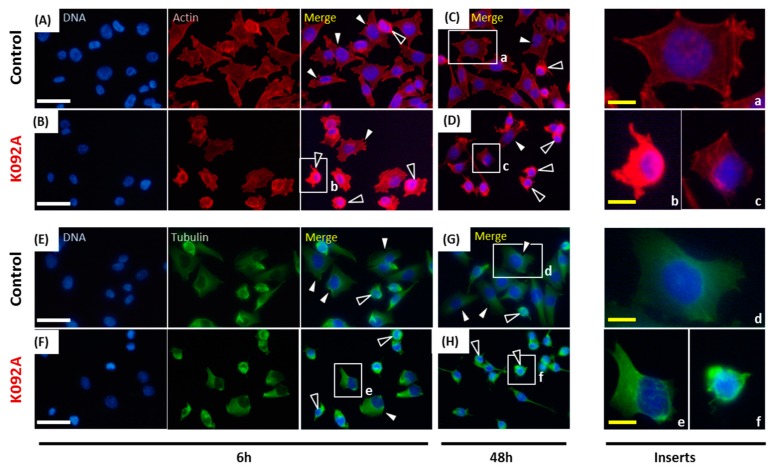
Figure 8.
Actin and tubulin aggregations in K092A-treated ZR-75-1 cells. (A–D) Actin was stained using phalloidin and nuclei using DAPI at 6 hpt (A,B) and 48 hpt (C,D) for control cells (A,C) and K092A-treated cells (B,D). Inserts (a–c) were focused in order to distinguish spread and adherent normal cells (white arrows) from cells with agglutinated actin (black arrows). (E–H) Tubulin was stained using anti-tubulin antibody and nuclei using DAPI at 6 hpt (E,F) and 48 hpt (G,H) for control cells (E,G) and K092A-treated cells (F,H). Inserts (d–f) were focused in order to distinguish spread and adherent normal cells (white arrows) from cells with agglutinated tubulin (black arrows). The white scale bar is 40 µm and yellow bar 10 µm.

