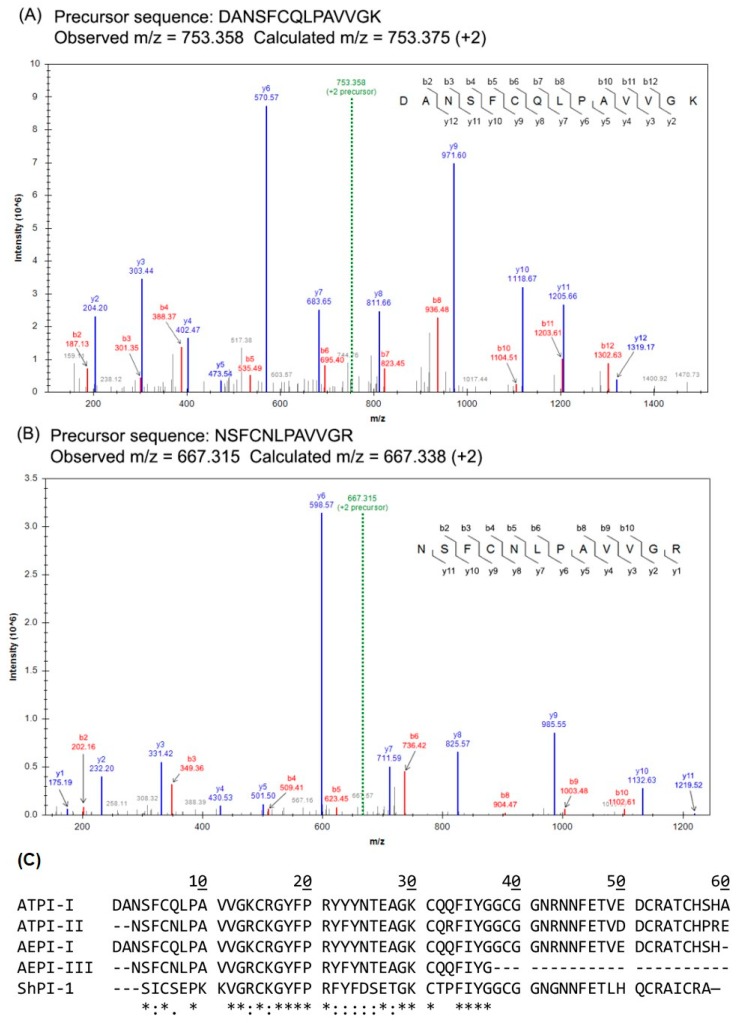
Figure 3.
Representative MS/MS spectra for ATPI-I and ATPI-II. ATPI-I and ATPI-II were digested with trypsin and analyzed by LC–MS/MS. (A) ATPI-I N-terminal sequence 1DANSFCQLPAVVGK14 and (B) ATPI-II N-terminal sequence 3NSFCNLPAVVGR14 were deduced from MS/MS spectra. Observed m/z values of the precursor ions are consistent with calculated values. Peaks corresponding to theoretical product ions are labeled. Most peaks were identified to be b- and y-series ions, as well as a few a- and z-series ions. All cysteines were alkylated by iodoacetamide, resulting in a +57.02 Da mass shift for this residue. (C) Full sequences of ATPI-I and ATPI-II in comparison with AEPI-I and AEPI-II from A. equina [27], and ShPI-1 from Stichodactyla helianthus [28]. Multiple alignment was performed using Clustal Omega [29]. An asterisk (*) indicates a fully conserved residue; a colon (:) indicates conservation between residues of strongly similar properties; a period (.) indicates conservation between residues of weakly similar properties [29].

