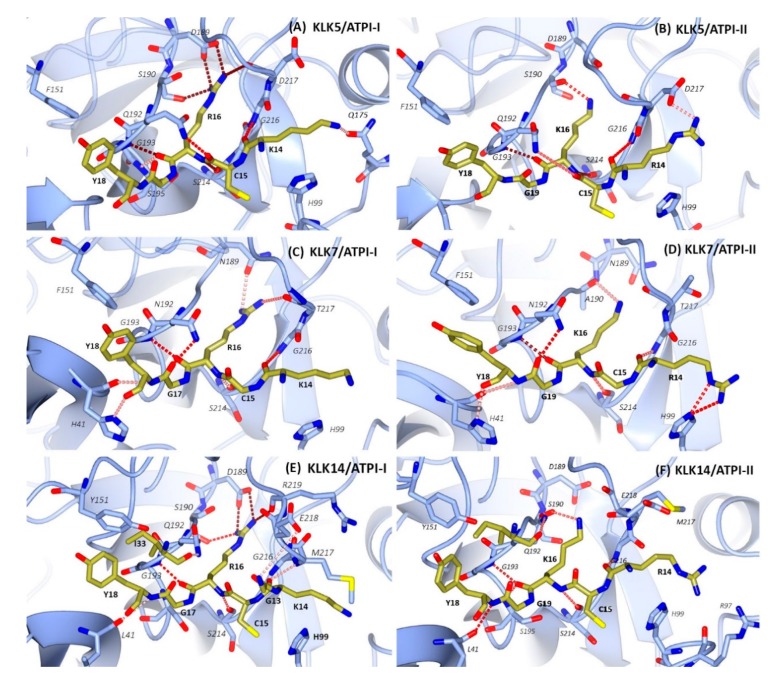
Figure 7.
Molecular modeling of ATPI inhibitors in complex with selected KLKs. The average structures were calculated from molecular dynamics simulations of the following complexes: (A) KLK5/ATPI-I, (B) KLK5/ATPI-II, (C) KLK7/ATPI-I, (D) KLK7/ATPI-II, (E) KLK14/ATPI-I, and (F) KLK14/ATPI-II. Proteases are depicted by blue ribbons, with the contacting residues shown in stick mode and carbon atoms colored blue. The contact residues of inhibitors (shown in stick mode with carbon atoms colored gold) lie in the active site of the protease. Intermolecular hydrogen bonds are depicted with dashed lines. Hydrogen bond occupancy is indicated by the shades of red, from pale pink (30%) to tan (>85%).

