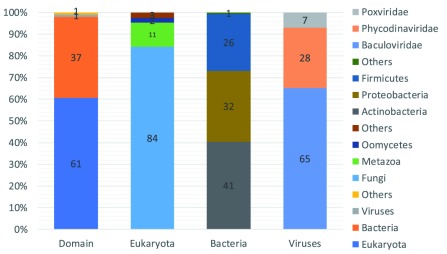
Figure 3. Taxonomic occurrence of LPMO sequences mined.
From left to right, the first bar shows the distribution of the sequences according to their Domain, Eukaryota, Bacteria, Viruses, Others, indicated in percentages of total sequences. The following three bars indicate the distribution (in percentages) of sequences as a function of the total number of sequences in the Domain (indicated below the bar).

