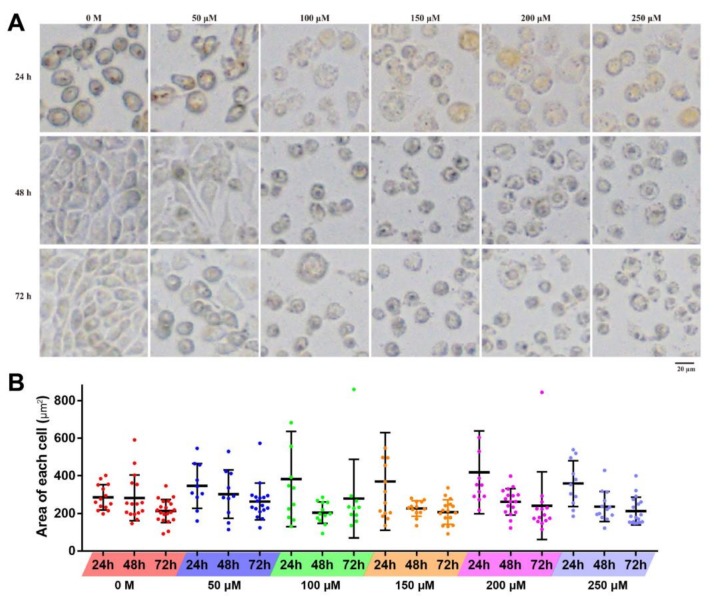
Figure 3.
Effects of resveratrol on the morphology of 4T1 cells. (A) 4T1 cells were treated with different concentrations of resveratrol (50, 100, 150, 200, and 250 µM) for 24, 48, and 72 h, respectively, then morphological changes were observed. Magnification: 100×. (B) The statistical diagram of the area of 4T1 cells. Error bars are standard deviations.

