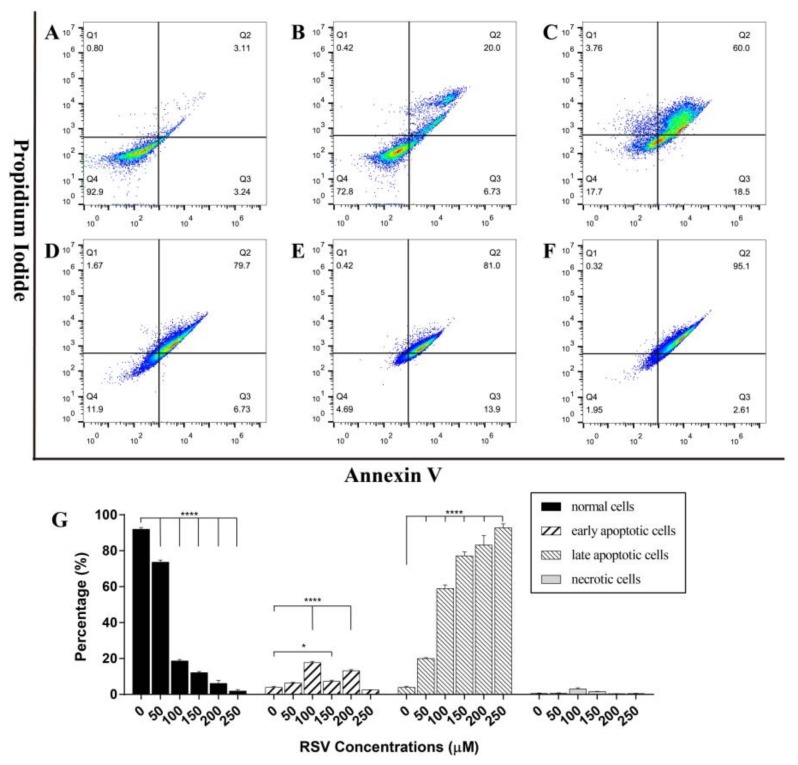
Figure 5.
The apoptosis of 4T1 cells was detected by flow cytometry. (A–F) Apoptosis stage diagram of 4T1 cells after 48 h treatment with different concentrations of resveratrol (A: 0 M; B: 50 µM; C: 100 µM; D: 150 µM; E: 200 µM; F: 250 µM). Cells in Q1, Q2, Q3, and Q4 quadrants are necrotic cells, late apoptotic cells, early apoptotic cells, and normal cells, respectively. (G) The ratio histogram of different cell types. The results are presented as mean ± standard deviation, and all samples were measured independently in triplicate. Error bars are standard deviations. Significant differences are indicated as * p < 0.05 and **** p < 0.0001.

