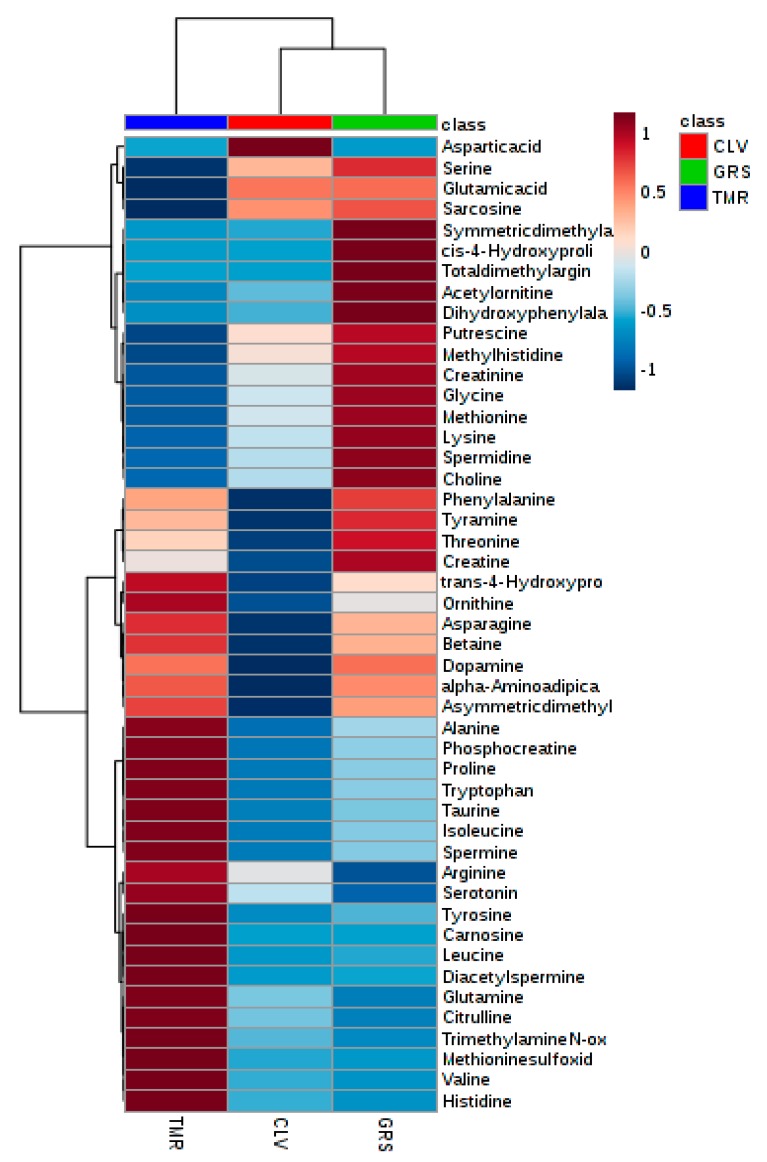
Figure 2.
Heatmap showing average SMP and whey ingredient metabolites from cows fed on perennial ryegrass (GRS), perennial ryegrass/white clover (CLV), or total mixed ration (TMR) feeding systems, determined by LC–MS/MS. Degree of positive and negative correlation between metabolite and diet is indicated by +1 (red) to −1 (blue).

