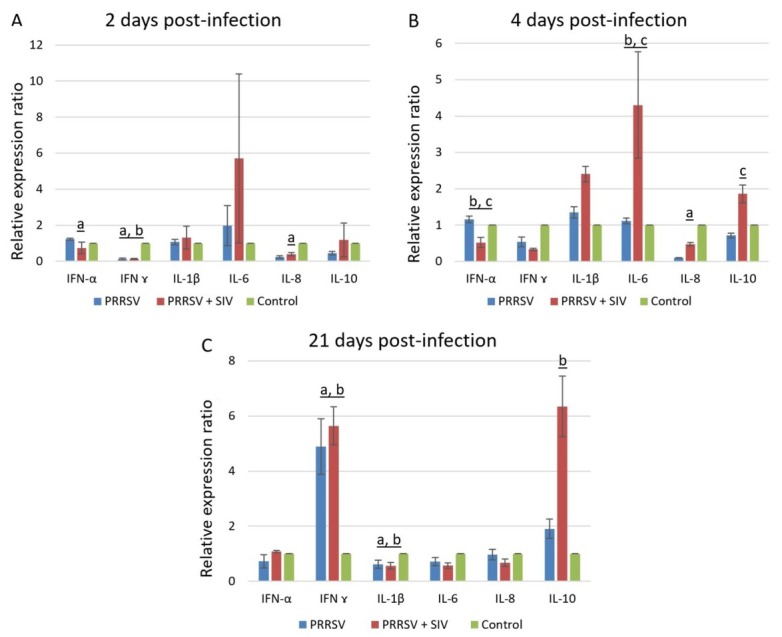
Fig. 2.

Mean (± SEM) cytokines mRNA expression profile in BALF cells following infection with PRRSV or co-infection with PRRSV and SIV at 2 dpi (A), 4 dpi (B), and 21 dpi (C). a – p < 0.05 between PRRSV-infected group and control group; b – p < 0.05 between co-infected group and control group; c – p < 0.05 between PRRSV-infected group and co-infected group
