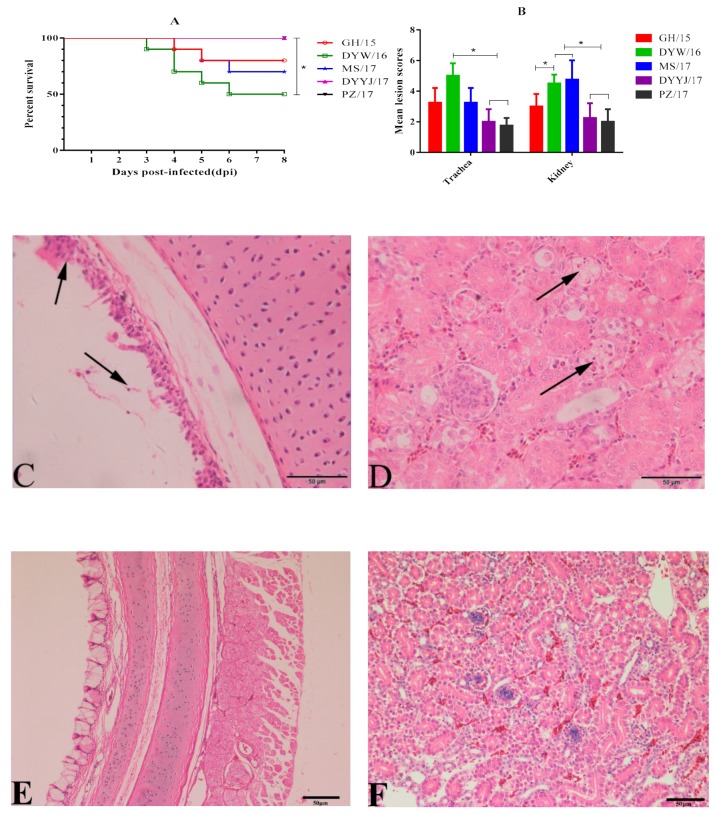
Figure 4.
(A): Survival percentage of ten chickens per group after challenge IBV (statistical differences between different groups were determined by using the analysis of Log Rank test. * p < 0.05 indicates a significant difference). (B) Trachea and kidney MLS of ten chickens per group infected with IBV (statistical differences between different groups were determined by using the analysis of Mann–Whitney U test. * p < 0.05 indicates a significant difference). (C) Degeneration and necrosis of the ciliated epithelial cells (black arrow). (D) Degeneration and necrosis in the renal tubules kidney (black arrow). E: normal trachea. F: normal kidney.

