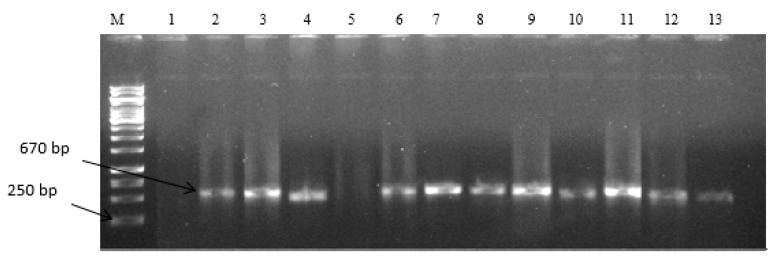
Figure 1.
Gel electrophoresis patterns for the expression of ITS1 and ITS4 regions at 670 bp in representative fungi isolated from feedlots of animals reared for food production. Lane M = DNA marker (1 kb); Lane 1 to 13 = positive amplification; Lane 1, and 5 = Negative amplification; and Lane 1 = No template (Internal control), Lane 2 = Aspergillus flavus ATCC 259622TM (Positive control).

