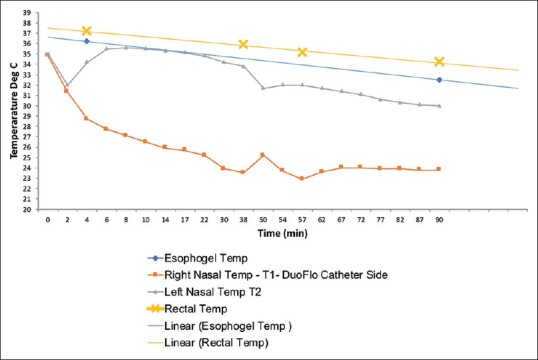
Figure 2.

Representative selective hypothermia curve. Note the dramatic difference between core temperatures (esophageal and rectal), and nasopharyngeal ipsilateral and contralateral to the TwinFlo device. The slope of the curves will vary depending on the rate of infusion and the temperature of the infused blood. However, at no point in this 90 min experiment did the core temperatures drop to an unsafe level (e.g. <33°C)
