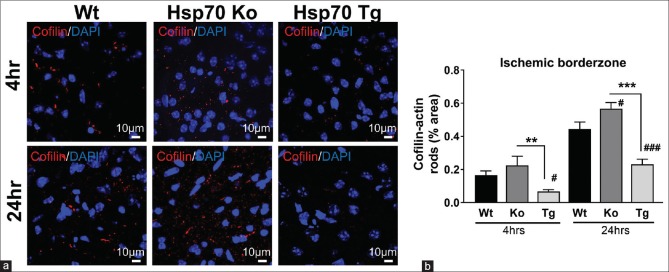
Figure 6.
Cofilin-actin rod formation within the ischemic borderzone was decreased by Hsp70 overexpression and increased by Hsp70 deficiency. (a) Representative images from the ischemic borderzone regions of wild type (Wt), Hsp70 knockout (Ko), and Hsp70 transgenic (Tg) brains show that cofilin staining (red) is the highest among the Hsp70 knockout brain and lowest in the Hsp70 transgenic brain, with intermediate staining in the wild-type brain. (b) Quantification of cofilin staining shows that Hsp70 deficient (knockout) brains had the most cofilin staining, while the least was seen in Hsp70 overexpression (transgenic). Wild-type brains had an intermediate amount of cofilin staining (#P < 0.05 vs. wild type, ###P < 0.001 vs. wild type; **P < 0.01, ***P < 0.001)

