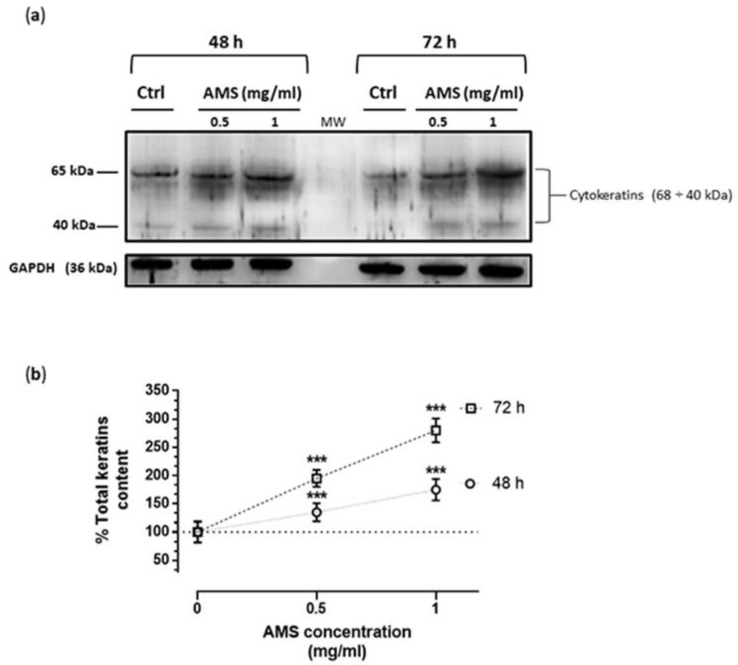
Figure 5.
Cytokeratin content in HHDPC after incubation with AMS. (a) Following treatments in vitro of HHDPC by 0.5 and 1 mg/mL of AMS formulation for 48 and 72 h, equal amounts of proteins (50 µg) were separated on a 10% SDS–polyacrylamide gel and subjected to Western blot analysis using monoclonal anti-Pan cytokeratin antibodies, which recognize human cytokeratins (“soft keratins”), as specified in the experimental section. Ctrl represents untreated control cells. The blot is representative of four independent experiments. (b) The cytokeratin bands within each lane were quantified by densitometric analysis and plotted in line graph as percentage of total cytokeratins compared to untreated control. The anti-GAPDH antibody was used to standardize the amounts of proteins in each lane. Shown are the averages ± SEM values of four independent experiments. *** p < 0.001 vs. control (untreated cells).

