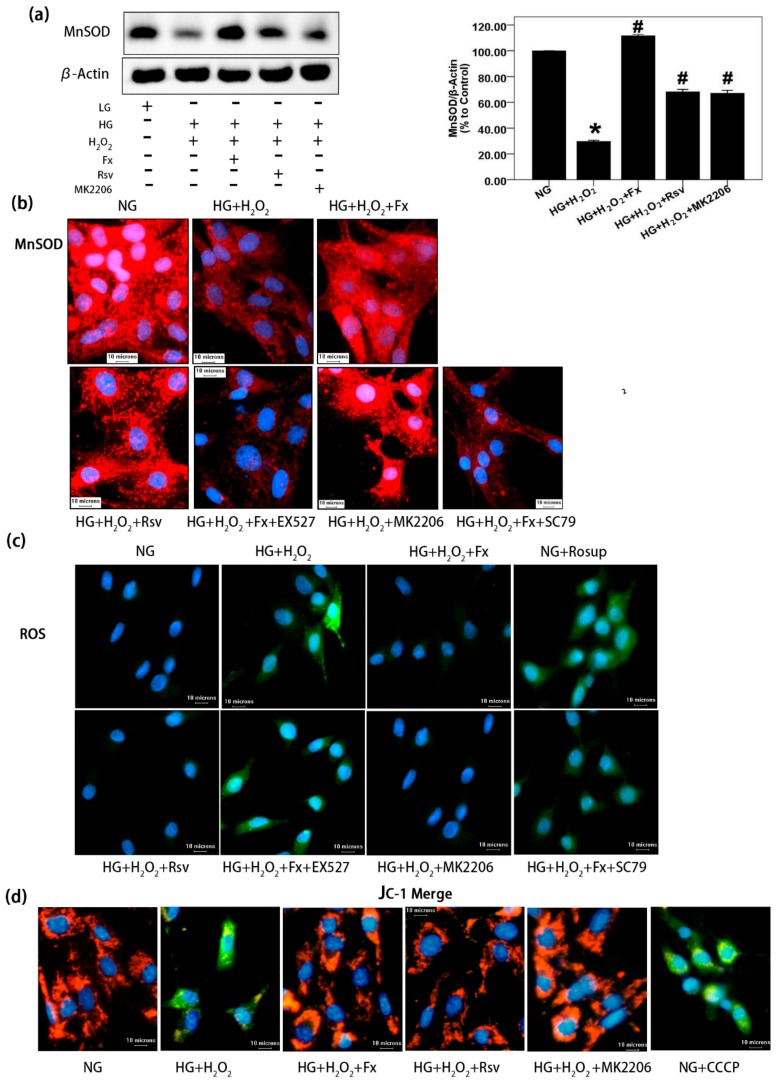
Figure 6.
Fx alleviates oxidative stress of GMCs cultured in HG through Akt/Sirt1/FoxO3α signaling. (a) After 24 h serum-free medium treated, the GMCs were induced with 150 μM hydrogen peroxide-contained HG, combined with or without Fx (2 μM), Rsv (40 μM), or MK2206 (2 μM), respectively, for 24 h. Then protein was extracted, and MnSOD was detected by western blot; β-actin was measured as the loading control, and experiments were repeated three times with similar results. * p < 0.05 vs. NG group, and # p < 0.05 vs. HG group. (b) The GMCs were treated with 150 μM hydrogen peroxide-contained HG combined with or without Fx (2 μM), Rsv(40 μM), MK2206 (2 μM), Fx (2 μM) combined with EX527 (1 μM), or Fx (2 μM) combined with SC79(20 μM), respectively, for 24 h, and MnSOD was detected by immunofluorescence method under Olympus IX71. Red fluorescence represents MnSOD, and blue fluorescence represents the nucleus; scale bar represents 10 um (400X). (c) The GMCs were induced oxidative stress with 150 μM hydrogen peroxide-contained HG combined with or without drug administration as previously, for 24 h. Rosup (10 μM) was used as a positive reagent to induce ROS for 30 min. ROS was stained with DCFH-DA for 30 min under dark condition and latter captured under Olympus IX71. Green fluorescence represents ROS; blue fluorescence represents the nucleus; and the scale represents 10 μm (400X). (d) GMCs were treated as previously and then incubated in the incubator with JC-1 for 30 min. Mitochondrial membrane potential was captured under Olympus IX71. Blue fluorescence represents the nucleus; green fluorescence represents JC-1 monomer; red fluorescence represents JC-1 aggregate, and the scale represents 10 μm (400 X).

