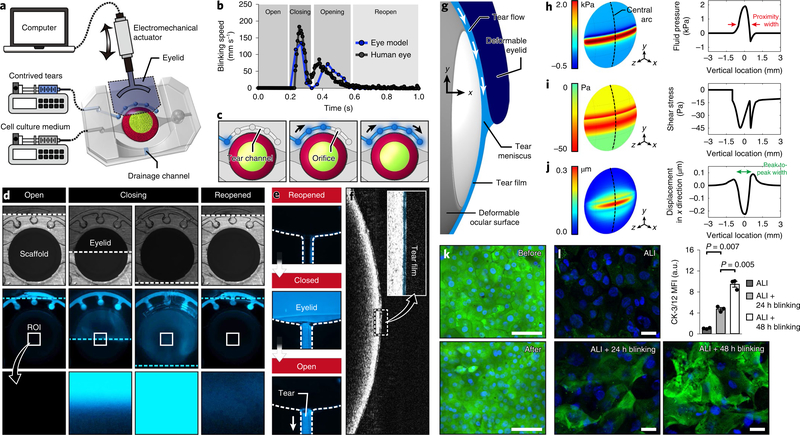
Fig. 3 |. Recapitulation of eye blinking and physiological biomechanical environment of the ocular surface.
a, Schematic of the experimental setup to simulate eye blinking that uses a computer-controlled electromechanical actuator to induce back-and-forth motion of the biomimetic eyelid. b, Kinematics of spontaneous blinking in the human eye (gray) and hydrogel eyelid actuation in our device (blue). Analysis of blinking speed in our system was performed twice. The human data were provided by Dr. Kyung-Ah Kwon at the University of Cambridge. c, Sequential illustration of tear injection and flow in the tear channel. d, Bright field (top row) and fluorescence (middle and bottom rows) images showing sequential phases of blinking and corresponding distribution of fluorescently labeled tear fluid (blue). The bottom row shows a blow-up of the region of interest (ROI) at the center of the ocular surface. The dotted lines in the top and middle rows indicate the eyelid margin. This experiment was replicated three times. e, Sequential fluorescence images showing the clearance of excess tear fluid pushed by the eyelid into the drainage channel during blinking. The dotted lines show the channel walls. This experiment was replicated three times. f, OCT images of a thin tear film on the ocular surface. The tear film is pseudo-colored blue in the inset. This experiment was replicated twice. g, Schematic of the elasto-hydrodynamic model of our in vitro system that includes blink-induced flow in the tear film and the deformation of the engineered ocular surface and the moving eyelid. The margin of the eyelid is located 1 mm below the mid-line during the down phase of a blink. h, Distribution of tear fluid pressure in the engineered ocular surface predicted by the theoretical model. The arrows in the graph mark the width of the proximity region in which pressure is positive and higher than 0.6 kPa. i,j, Heat maps of fluid shear stress (i) and the vertical displacement of the engineered ocular surface (j). The peak-to-peak width in j represents the width of depression. k, Viability staining of the epithelial cells before and after 150 cycles of blinking. Green, calcein AM; blue, DAPI. Scale bar, 100 μm. This experiment was replicated three times. l, Immunofluorescence images of CK-3/12 (green) in the corneal epithelial cells. Top left, 2 d submerged culture followed by 3 d ALI culture without blinking. Bottom left, 2 d submerged culture followed by 2 d ALI culture without blinking and an additional 1 d ALI culture with blinking. Bottom right, 2 d submerged culture followed by 1 d ALI culture without blinking and an additional 2 d ALI culture with blinking. Green, CK-3/12; blue, DAPI. Scale bar, 20 μm. Data are mean ± s.e.m. of fluorescence intensity normalized to the ALI group from three independent experiments. P values by unpaired, two-sided t-test.

