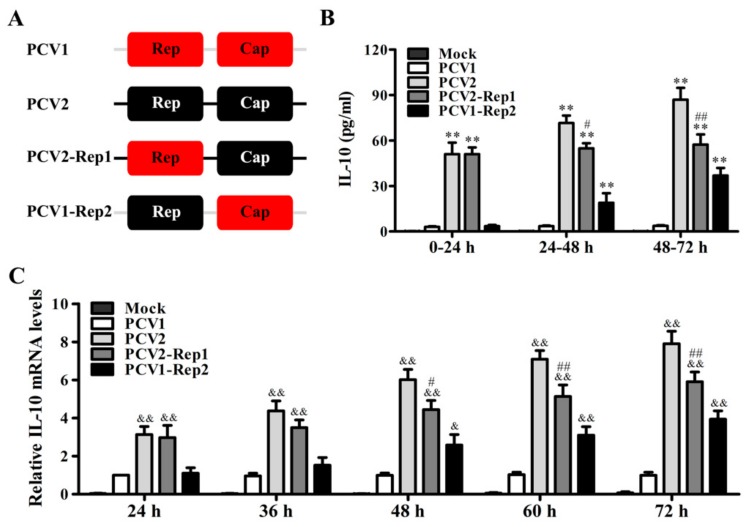
Figure 1.
PCV2 Rep enhances the production of IL-10 in PAMs. (A) Model of construction of PCV1-Rep2 and PCV2-Rep1. The gray and dark lines represent the PCV1 and PCV2 backbones, respectively. (B) PAMs were infected with Mock, PCV1, PCV2, PCV2-Rep1, or PCV1-Rep2, and IL-10 production was analyzed by ELISA for 0–24 h, 24–48 h, and 48–72 h p.i. The columns indicate IL-10 production in each 24 h in the culture supernatants. (C) The IL-10 mRNA levels of the PAMs infected with Mock, PCV1, PCV2, PCV2-Rep1, or PCV1-Rep2 were detected by quantitative PCR at the indicated times post-infection. The results are mean ± SEM of three independent experiments. **P < 0.01 versus Mock infection at the same infection time point. #p < 0.05, ##p < 0.01 versus PCV2-infected cells at the same infection time point. &&p < 0.01 versus PCV1 infection at the same infection time point.

