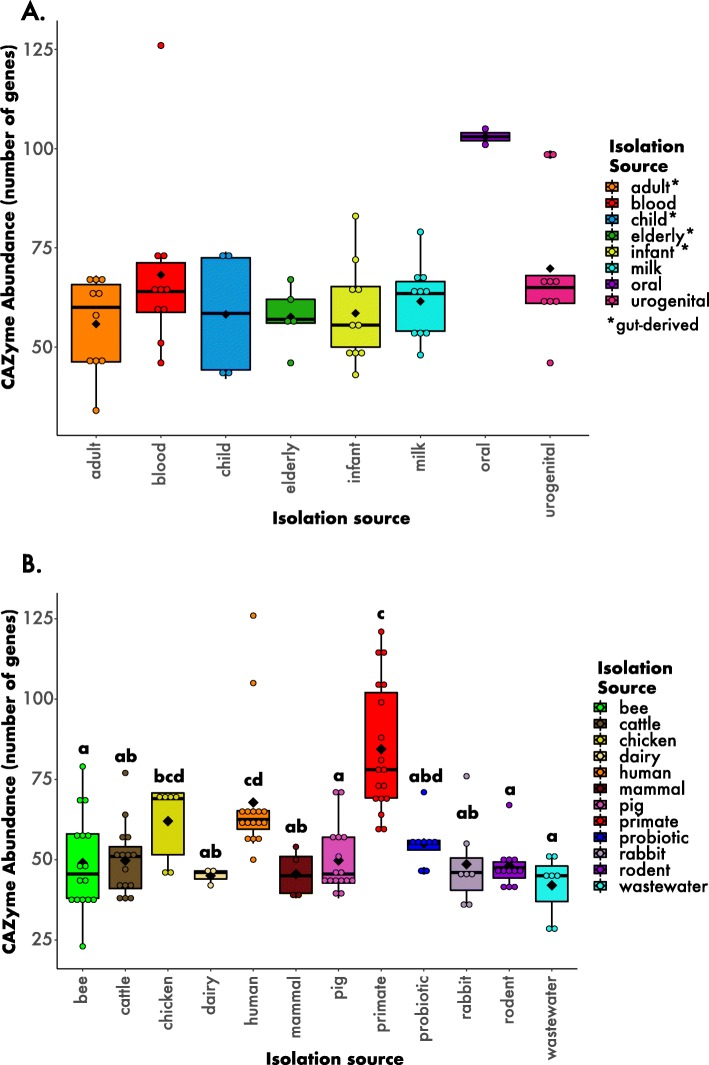
Fig. 5.
CAZyme abundances for strains isolated from A) humans and B) multiple hosts and environments. The circles depict the data points and the black diamonds represent the mean of each boxplot. The letters above each box represent the post hoc comparisons using Dunn’s test. See Methods and Fig. 1 legend for more information about the isolation categories

