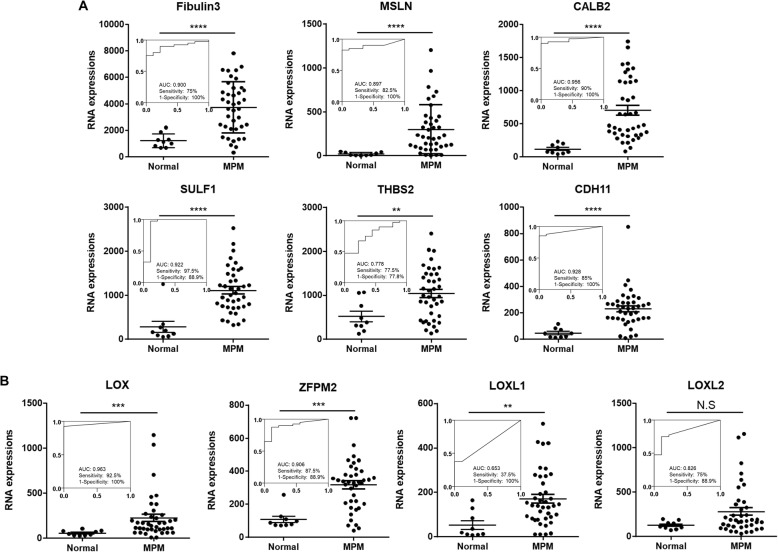
Fig. 2.
Diagnostic potential of LOX family and ZFPM2. Using the GEO database (GSE2549), mRNA expression of known biomarker (a) or candidate genes (b) were analyzed in normal (n = 9) and MPM tissues (n = 40). Each dot represents one sample, values are mean ± SEM of each groups. Statistical analysis between normal and MPM groups was executed using unpaired Student t-test. (**** p < 0.0001, *** p < 0.001, ** p < 0.01, * p < 0.05). The In-let represents ROC curves illustrating diagnostic ability of known biomarkers (a) and candidates (b). X and Y axes stands for sensitivity as well as 1-specificity, respectively. Maximal sensitivity and specificity were determined by Youden’s method. AUC (Area Under Curve)

