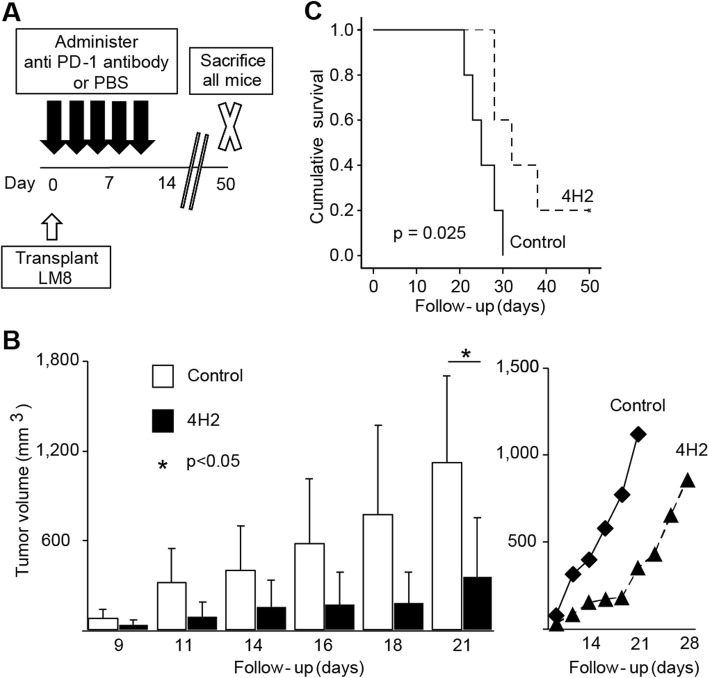
Fig. 2.
Anti-PD-1 antibody improves survival curve in vivo. The LM8 murine osteosarcoma cell line was subcutaneously transplanted to the dorsal region of the C3H mouse, and 4H2 was administered (n = 5). Error bars indicate S.D. a Schema of experimental overview. b Changes in tumour volume with time to first death. The right line graph plots the mean value of the tumour volume. c Evaluation of overall survival rate by Kaplan-Meier curve. P value of log rank method was 0.025

