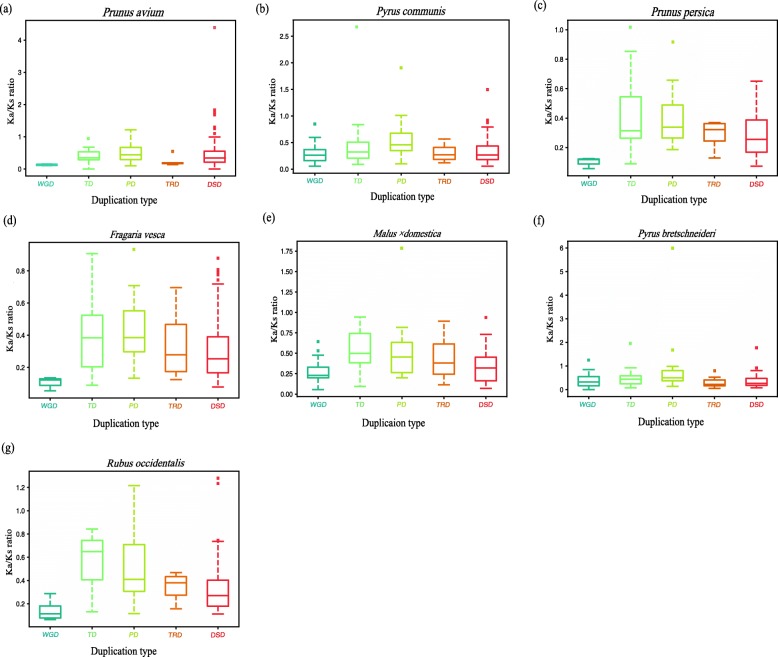
Fig. 6.
Ka/Ks ratio of seven Rosaceae species. We analyzed the Ka/Ks values using coding sequences. The x-axis represents five different duplication categories. The y-axis indicates the Ka/Ks ratio. a: sweet cherry; b: European pear; c: peach; d: strawberry; e: apple; f: Chinese white pear and g: black raspberry

