
Fig. 7.
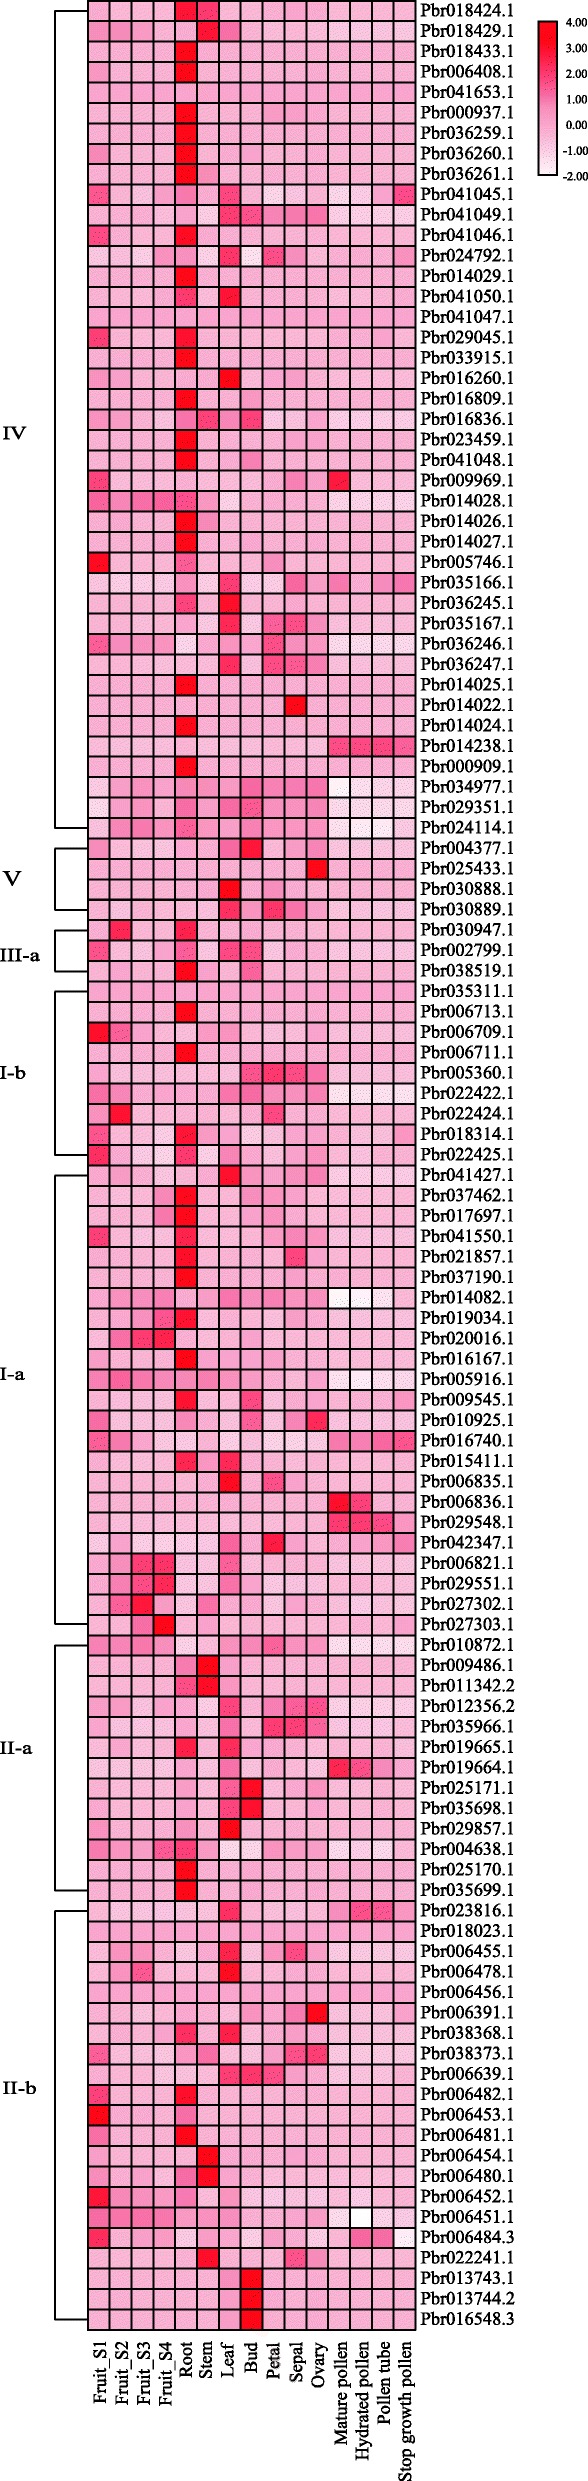
Heat map analysis of BAHD genes in pear. RNA-seq data was used to determine the expression patterns of BAHD gene. The classes IV–II-b on the left indicate the different clades. Fruit_S1–Fruit_S4 indicate the four distinct stages: on 16th May 2015 (Fruit_S1); 1st July 2015 (Fruit_S2); 31st July 2015 (Fruit_S3); and 29th August 2015 (Fruit_S4). Dark red indicates high expression, and light pink indicates low expression