Fig. 5.
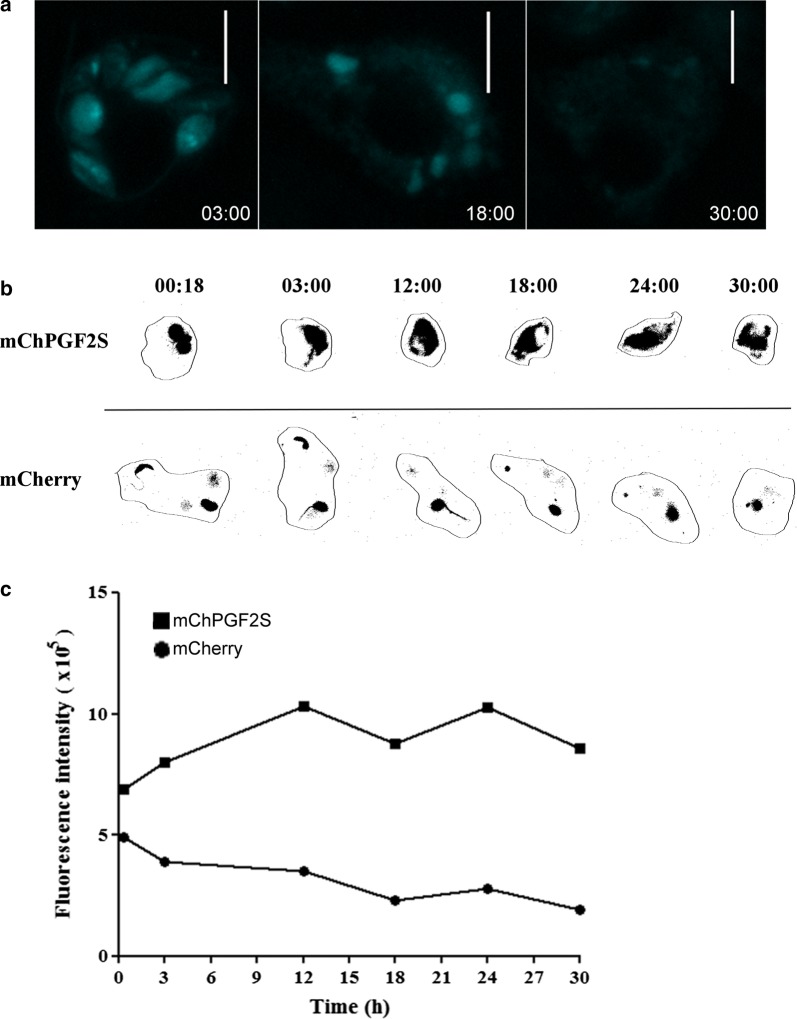
Detection of mChPGF2S in highly-infected macrophages. a Detection of mCherry fluorescence in the host cell cytoplasm. Time-lapse images of macrophages infected with more than three mChPGF2S parasites. Cyan was used as pseudocolor; numbers at the bottom right of each panel indicate hour:minutes after infection. b Close image analysis of mCherry and mChPGF2S localized fluorescence intensity in infected macrophages. Numbers at the top of each image indicate hour:minutes after infection. c Overall intracellular fluorescence in infected macrophages was quantified using FIJI (ImageJ) software up to 30 h pi. Scale-bars: a, 10 µm

