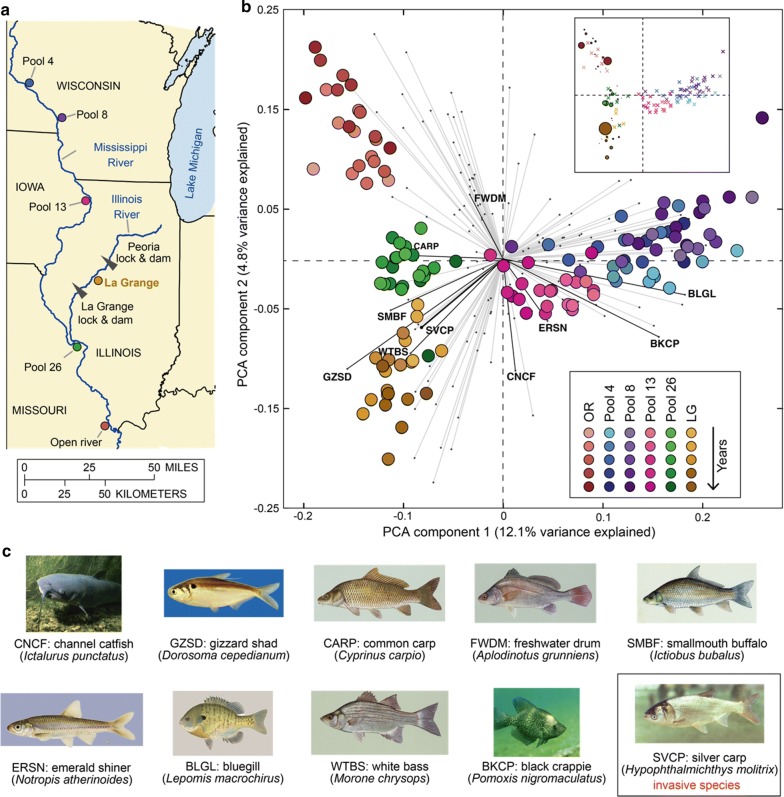
Fig. 1.
Field measurement provides population dynamics data on the freshwater fish community in the Upper Mississippi and Illinois Rivers. a Geographical location of the six stations monitored by the Long Term Resource Monitoring Program. The La Grange (LG) pool, located in the Illinois River, is the focus of the study. This map was modified from Fig. 1 in Zhu et al. [41]. b Biplot of principle component analysis (PCA). Each circle (“score”) represents the species abundance distribution of fish community associated with a site and year combination. The color brightness of circles indicates the passage of time (from 1993 to 2015): lighter colors represent earlier data. Each line (“loading vector”) represents contribution of an explanatory variable (fish species) to the variance of the first two principle components. For all loading vectors, the top 9 dominant native fish species in the LG pool plus silver carp, an invasive species, are colored in black while all others are colored in light gray. The inset is the same PCA score plot, but the circle size is scaled to be proportional to the abundance of invasive silver carp (samples missing silver carp are represented with crosses). c Common names, abbreviations, and species names of the 10 fish species investigated in our study. Fish images were obtained through public domain resources except for silver carp licensed by CC BY 3.0 and gizzard shad provided by Chad Thomas of Texas State University

