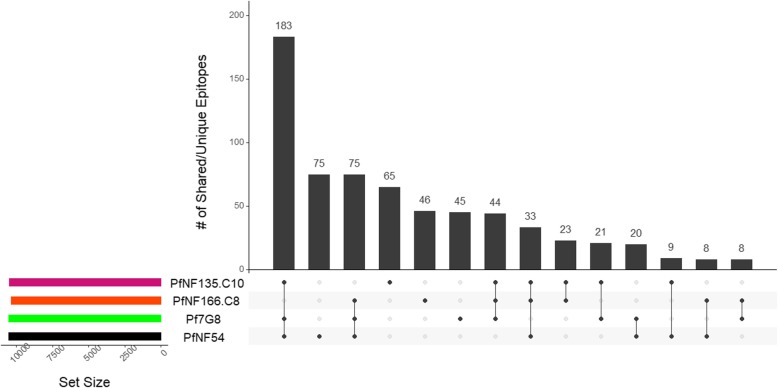
Fig. 3.
Comparison of predicted CD8+ T cell epitopes from pre-erythrocytic antigen amino acid sequences. CD8+ T cell epitopes were predicted in silico for 42 confirmed or suspected pre-erythrocytic antigens (See Additional file 2: Table S7 for a complete list of genes included in this analysis). The plot shows the number of shared or unique epitopes, as compared between different PfSPZ strain groupings. The height of the bar is the number of epitopes that fell into each intersection category, and the horizontal tracks below the bars show the PfSPZ strains that are included in that intersection. For example, the first bar represents the number of shared epitopes between NF54, 7G8, and NF135.C10. At the bottom left, colored tracks represent the total number of epitopes predicted across all genes (> 10 k for each strain). As the vast majority of predicted epitopes were shared among all four strains, that group was removed from the bar plot to achieve better visual definition for the other comparison

