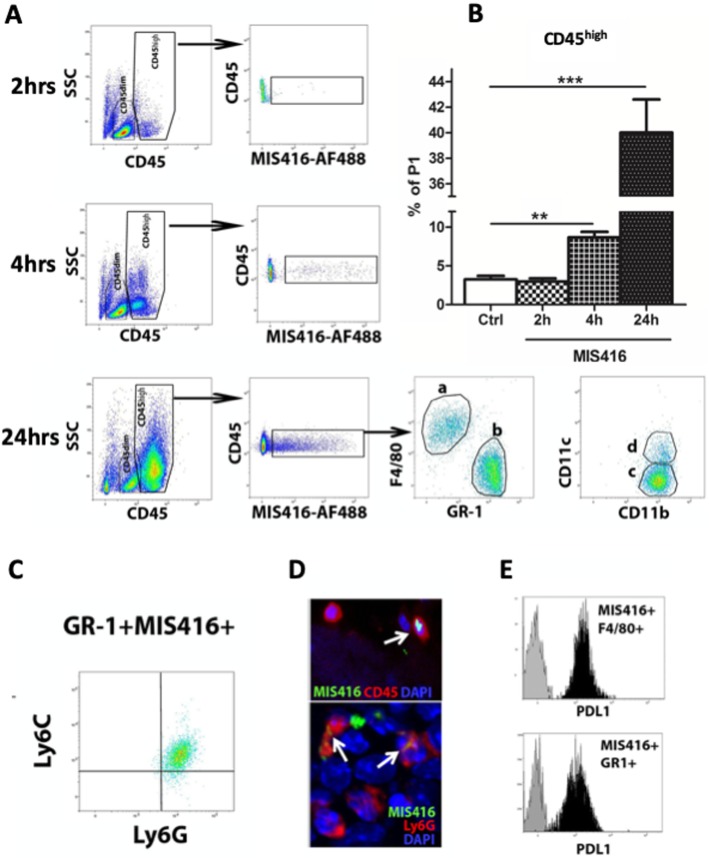
Fig. 1.
Intrathecal MIS416 is taken up by phagocytic monocytes and neutrophils in CNS. a Representative flow cytometry profile showing the distribution of CD45high and CD45dim cell populations in the CNS of control (Ctrl) and MIS416-treated mice at 2, 4 and 24 h. MIS416+CD45high cells were detected in the CNS following intrathecal MIS416 delivery. The MIS416+CD11bhighCD45high cell population included F4/80+GR-1lowCD11c−/+ (a and c and d) and F4/80−Gr-1highCD11c− cells (b and c). b bar graphs show proportion of CD45high cells at 2, 4 and 24 h. c Representative flow cytometry profile showing GR-1+MIS416+ cells to be Ly6clowLy6Ghigh. d Micrographs showing colocalization of MIS416 (green) with CD45+ or Ly6G+ (red) cells (arrows) located in the extraparenchymal compartment of the CNS that had received MIS416-AF88 by intrathecal injection 4 h before. DAPI (blue) shows nuclear staining. e MIS416+GR-1high and MIS416+F4/80+ cells were analyzed for the expression of PDL-1 by flow cytometry. Gray histograms represent fluorescence minus one (FMO) staining, and black histograms represent positive staining for PDL-1. Data are presented as mean ± SEM. (n = 5–12 per group). Results were analyzed using the two-tailed Mann-Whitney u-test; * p < 0.05, ** p < 0.01, *** p < 0.001

