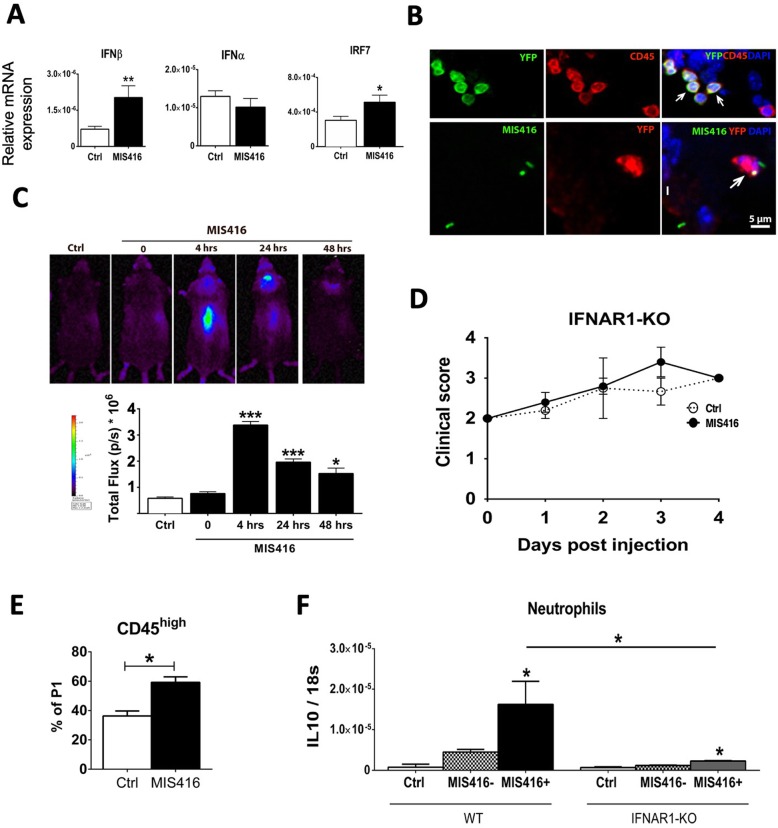
Fig. 4.
Intrathecal MIS416 transiently induced IFNβ in CNS, and inhibited progression of EAE in an IFNAR1-dependent manner. a Expression of IFNβ, IFNα, and IRF7 in the CNS from MIS416 treated or control mice were analyzed by RT-qPCR (n = 3–5 per group). b Micrographs showing colocalization of IFN-β/YFP+ (green) with CD45+ (red) cells (arrows) located in the extraparenchymal compartment of the CNS that had received MIS416-AF88 by intrathecal injection 4 h earlier. b Micrographs showing colocalization of MIS416-AF488 (green) and IFNβ/YFP (red) in a parenchymal cell (arrow). DAPI (blue) shows nuclear staining. c IFNβ/Luciferase reporter mice received MIS416 by intrathecal injection and luciferase activity was visualized and quantified after 4, 24 and 48 h. c MIS416 induced IFNβ in the brain and spinal cord. The expression was strongest at 4 h and was reduced in following days. c Bar graph shows the quantification of luciferase activity at indicated time points (n = 3–4 per group). d IFNAR1 deficient mice were immunized with MOG p35–55 to induce EAE and clinical signs were scored daily. The protective effect of MIS416 was not seen in mice lacking the receptor for Type I IFN (n = 5 per group). e Bar graph shows the percentage of CD45high cells in the CNS of IFNAR1-deficient mice during EAE, analyzed by flow cytometry. MIS416 induced recruitment of CD45high cells in the CNS (n = 6–9 per group). f Neutrophils were sorted from the brain of B6 (n = 6) and IFNAR1 deficient mice (n = 4) with EAE, 1 day post MIS416 injection, and IL-10 gene expression was analyzed by RT-qPCR. Data are presented as mean ± SEM (n = 3–4 per group); Results were analyzed using one-way ANOVA with Bonferroni multiple comparison test. * p < 0.05, ** p < 0.01, *** p < 0.001

