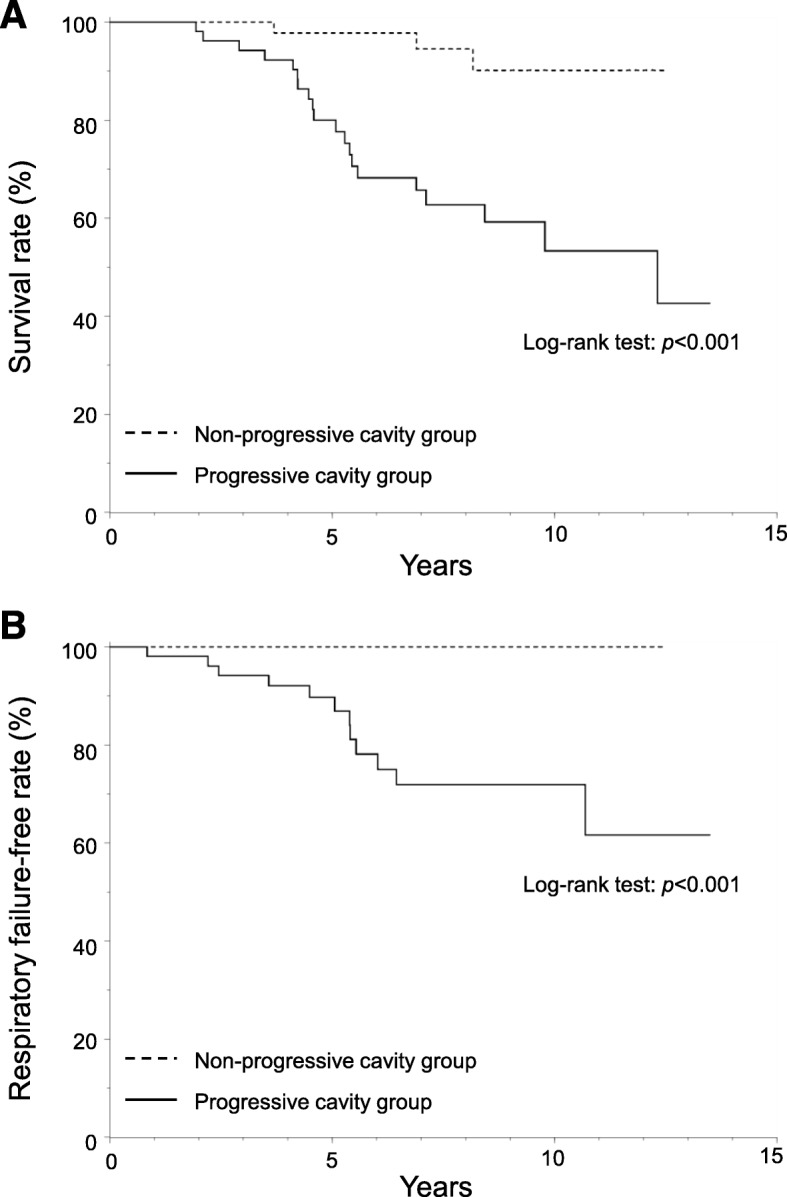
Fig. 3.

All-cause mortality and respiratory failure in progressive and non-progressive cavity groups. Panel A shows the Kaplan–Meier survival curves of all-cause mortality. Panel B shows the Kaplan–Meier survival curves of respiratory failure. P values from the log-rank test were used to examine differences in the Kaplan–Meier curves
