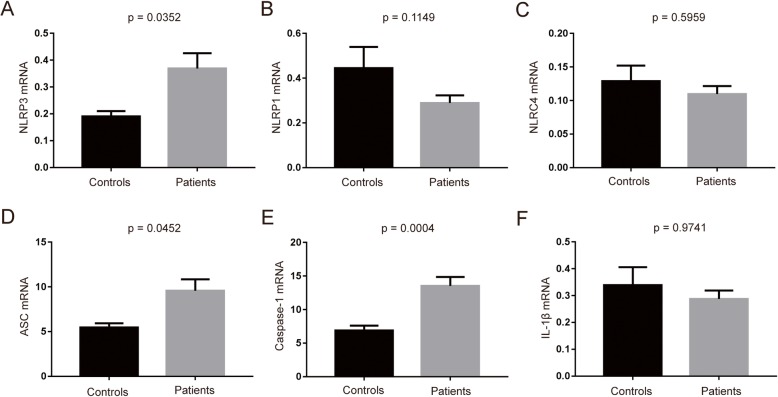
Fig. 1.
Expression of inflammasome-related genes in the PBMCs of PD patients and healthy controls. a–c NLRP3, NLRP1, and NLRC4 mRNA expression levels relative to GAPDH were determined by RT-qPCR analysis as described in the “Methods” section. d–f ASC, Caspase-1, and IL-1β mRNA expression relative to GAPDH were determined by RT-qPCR analysis. n = 24 for control, n = 43 for PD groups respectively. Data are expressed as mean ± SEM, one-way ANOVA

