Fig. 1.

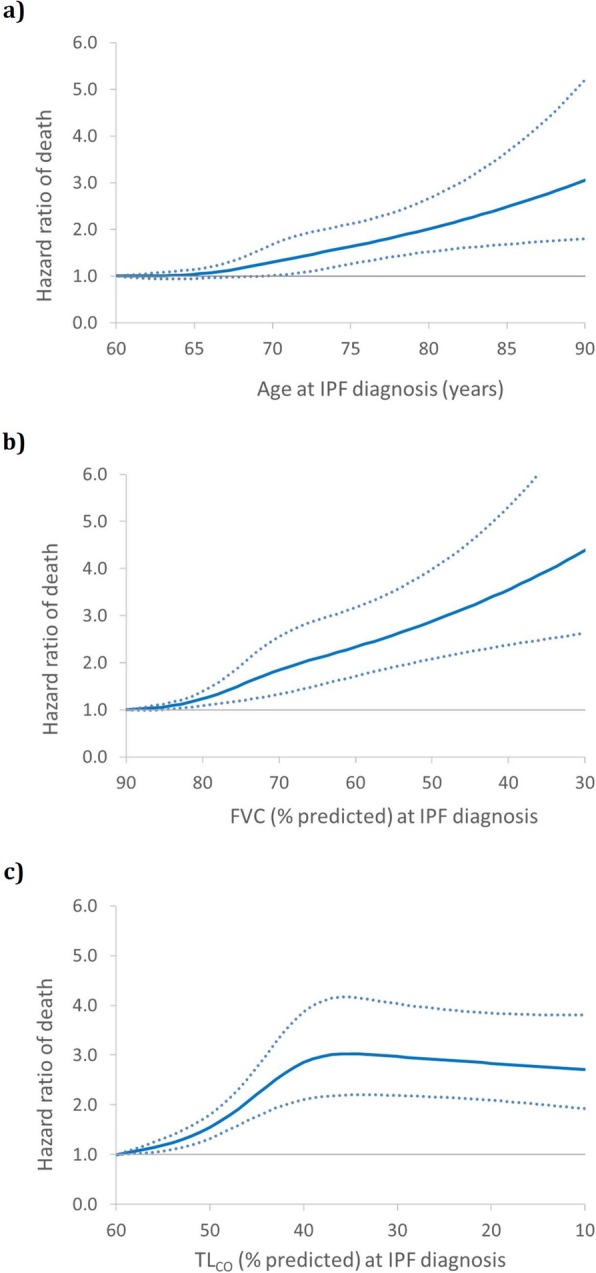
Smooth cubic spline curve of the adjusted hazard ratio (solid line) and 95% CIs (dotted lines) of death, estimated by Cox proportional hazards model, as a function of: a) age at IPF diagnosis; b) % predicted FVC; and c) % predicted TLCO

Smooth cubic spline curve of the adjusted hazard ratio (solid line) and 95% CIs (dotted lines) of death, estimated by Cox proportional hazards model, as a function of: a) age at IPF diagnosis; b) % predicted FVC; and c) % predicted TLCO