
Figure 1.
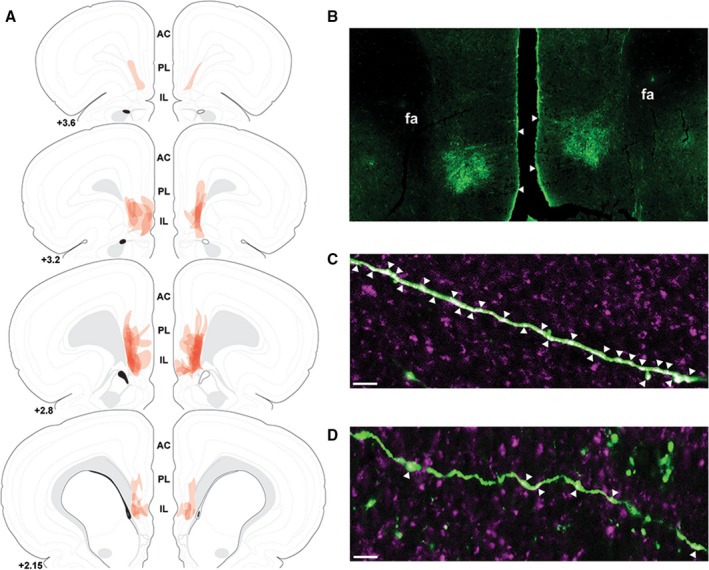
The spread of individual lentiviral injections was traced on photomicrographs and overlaid onto atlas templates from Swanson40 to depict the localization of vesicular glutamate transporter 1 knockdown in experiment 1 (A). Lentiviral injections targeted to the infralimbic cortex with minimal spread to the prelimbic cortex (B). White arrows indicate dorsal and ventral boundaries of the infralimbic cortex. Immunolabeling of green fluorescent protein (green) and vesicular glutamate transporter 1 (magenta) indicated a high degree of co‐localization (white arrows) on infralimbic cortex projections in green fluorescent protein controls (C). Knockdown of vesicular glutamate transporter 1 with small interfering RNA treatment decreased vesicular glutamate transporter 1 co‐localization with green fluorescent protein on infralimbic cortex projections (D). Scale bars: (B) 100 μm, (C,D) 10 μm. Numbers indicate distance rostral to bregma in millimeters. AC indicates anterior cingulate; fa, anterior forceps of the corpus callosum; IL, infralimbic cortex; PL, prelimbic cortex.