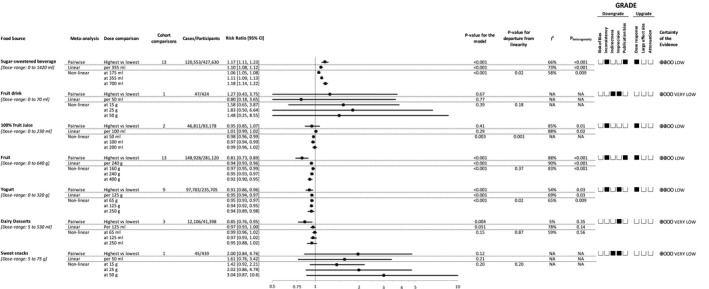
Figure 2.

Relation of sources of fructose‐containing sugars and incident hypertension. Pair‐wise summary estimates were derived from pooled risk ratios for highest vs lowest intake of the food sources. Estimates of linear and nonlinear dose‐response relationships are presented per intake level indicated in the column, “dose comparison.” Dose‐ranges are rounded to the nearest five. Data are expressed as risk ratios (RRs) with 95% CIs. Values of I2≥50% indicate substantial heterogeneity. RRs >1.0 indicate a harmful association. The Grading of Recommendations, Assessment, Development and Evaluation of prospective cohort studies are rated as “low” certainty of evidence and can be downgraded by 5 domains and upgraded by 3 domains. Filled black squares indicate downgrade or upgrades for each outcome. NA indicates not applicable.
