
Figure 2.
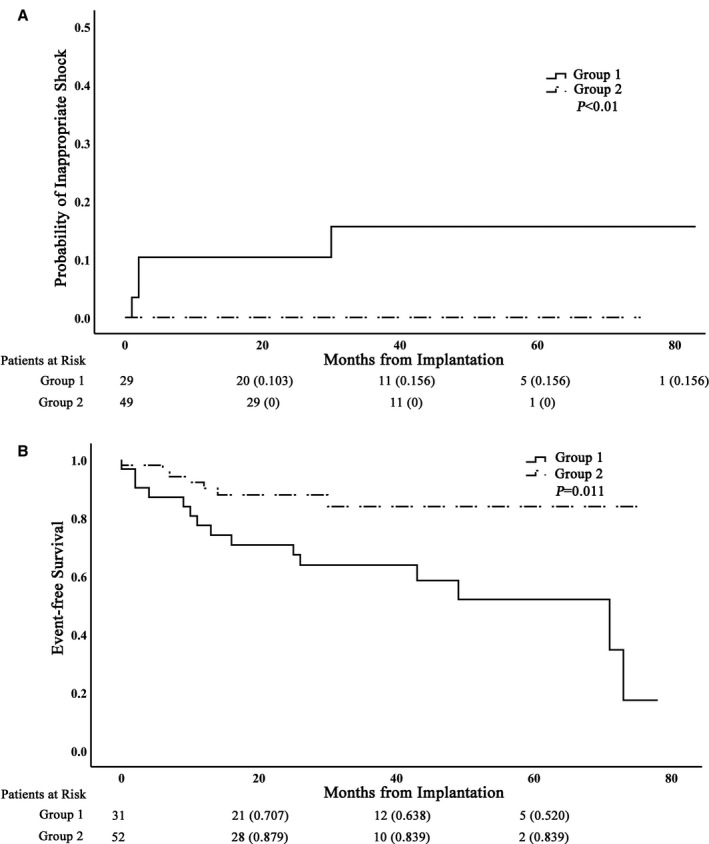
Kaplan–Meier curves showing probability of inappropriate shocks and event‐free survival. A, The cumulative proportion of patients who experienced a first inappropriate therapy is plotted against time. B, Kaplan–Meier survival curves for adverse outcomes (death or heart failure hospitalization). The number of patients at risk at a given time point of follow‐up is indicated below the x‐axis.