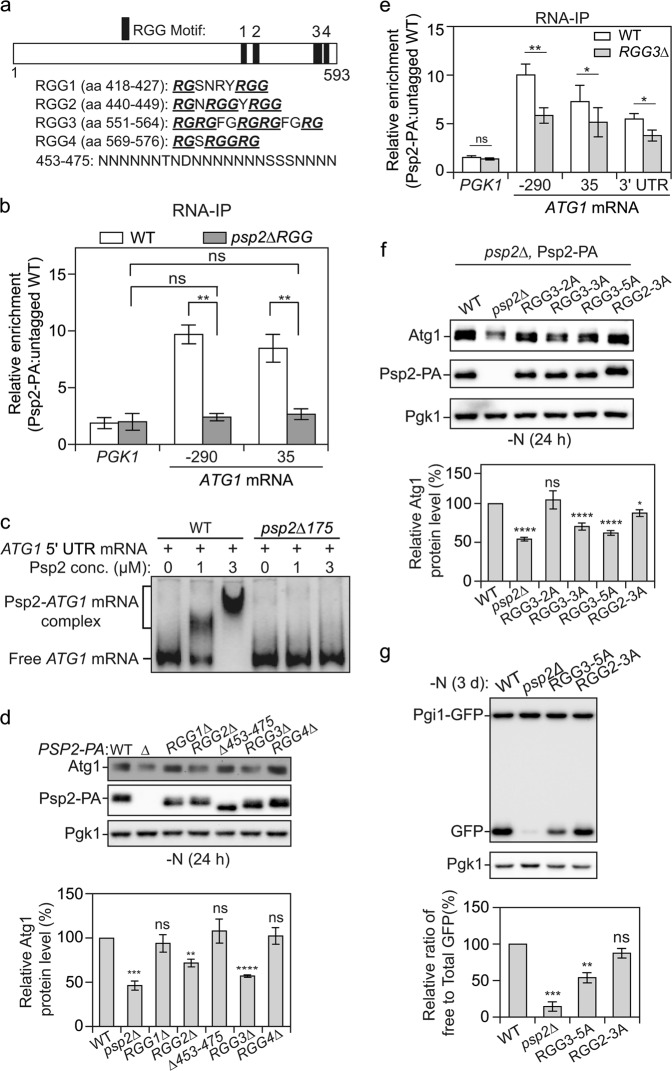
Fig. 3.
Psp2 promotes ATG gene expression in an RGG-motif-dependent manner. a The indicated positions and sequences of RGG motifs (1 to 4) in Psp2 are shown. RG/RGG repeats in the RGG motif are bolded and underlined. b The RGG motif in Psp2 is important for ATG1 mRNA binding in vivo. WT (SEY6210), PSP2-PA (YZY051) and psp2∆175-PA (YZY116) cells were subjected to RNA immunoprecipitation. The enrichment of the indicated ATG1 mRNA fragments was measured by qRT-PCR experiments, quantified and shown as in Fig. 2a; PGK1 mRNA served as a negative control. Student’s t-test; **P < 0.01; ns not significant. c The RGG motif in Psp2 is required for ATG1 mRNA binding in vitro. A 500-bp construct representing the 5′ UTR of the ATG1 transcript was incubated with increasing concentrations of purified recombinant full-length Psp2 and Psp2∆175. A representative gel is shown. d RGG2 and RGG3 in Psp2 are important for its function in regulating Atg1 expression. WT (YZY051), psp2∆ (YZY050), and cells with the indicated truncations were grown in YPD medium until mid-log phase and then starved for nitrogen for 1 day. The Atg1 level was analyzed by western blot. Representative images and quantification of the data are shown. Mean ± SEM of n = 3 independent experiments are indicated. Student’s t-test; **P < 0.01, ***P < 0.001, ****P < 0.0001; ns not significant. e The RGG3 motif in Psp2 is important for ATG1 mRNA binding. WT (SEY6210), PSP2-PA (YZY051), and PSP2[RGG3∆]-PA (YZY169) cells were subjected to RNA immunoprecipitation. The enrichment of the indicated ATG1 mRNA fragments was measured by qRT-PCR experiments, quantified and shown as in Fig. 2a). PGK1 mRNA served as a negative control. Student’s t-test; *P < 0.05, **P < 0.01; ns not significant. f Arginines in the RGG2 and RGG3 motifs are important for the function of Psp2. The Atg1 level was measured by western blot in the indicated strains after 1 day of nitrogen starvation. A representative image and quantification are shown. Mean ± SEM of n > = 4 independent experiments are indicated. Student’s t-test; *P < 0.05, ****P < 0.0001; ns not significant. g The Pgi1-GFP processing assay was performed in the indicated strains. Cells were grown in YPD medium until mid-log phase and then starved for nitrogen for 3 days. The processing of Pgi1-GFP was quantified as in Fig. 1f. Mean ± SEM of n = 3 independent experiments are indicated. Student’s t-test; **P < 0.01, ***P < 0.001; ns not significant

