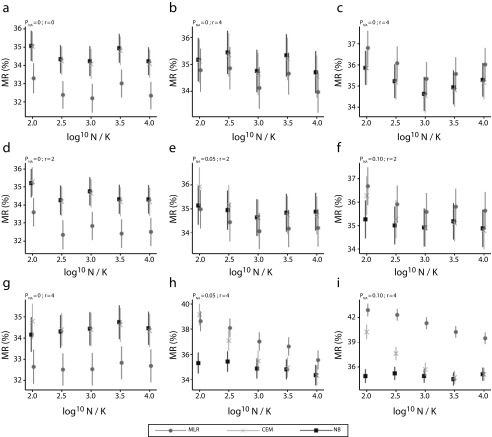
FIGURE 2—
Misclassification Rate (MR) of Multinomial Logistic Regression (MLR), Coarsened Exact Matching (CEM), and Naïve Bayes Classifier (NB) by Relative Sample Size (log10N/K) Under Different Scenarios: Taiwan, 2008–2016
Note. The 9 scenarios are generated from the combination of proportion of missing data (PNA, valued 0%, 5%, or 10%) and number of redundant covariates (r, valued 0, 2, or 4). Each scenario contains 1000 iterations, where there are K = 20 target underlying-cause-of-death groups, 2 effective covariates, and a set of multiple causes of death.

